
2. Liquid Drop Model#
Quick Links
From the Reading List:
Semi-empirical mass formula Martin Chapter 2.3
2.1. Introduction#
Following on from last week, we need to consider what the charge and mass distribution may be in nuclei and how is the Hofstadter experiment interpreted to tell us about it? We know from Rutherford’s scattering experiments that nucleons are likely incompressible. In this unit we’ll see how assuming an incompressible fluid model for the nucleus gives us a simple empirical way to describe differences in nuclear binding energies. You may already have some exposure to this through studies of the semi-empirical mass formula in year two, but in this course we are going to dig deeper into the reasoning behind this model and its strengths and weakness, to justify future extensions.
2.2. Form Factors#
Based on what we saw in the last unit, our models that assumed scattering of a point-like nuclei needed to be modified to better fit observed data. To factor in the possibility of scattering from a distribution of charges we need to introduce a so called Form-Factor, \(F\), that encompasses information on the structure of the nucleus.
The modified electron scattering cross-section for a target with a distributed charge distribution can be written as
where \({\bf q}\) is the four-momentum transfer of the interaction, calculated from the incoming electron momentum, \({\bf p}_{1}\), and outgoing electron momentum, \({\bf p}_{2}\), as \({\bf q} = {\bf p}_{1}-{\bf p}_{2}\), \(F\) is our form factor, and the point-like cross-section is our Mott prediction from the previous unit.
To reiterate, a form factor, \(F\), provides additional information on how the distributed structure of the nucleus modifies the interaction probability. We can see in the equation above that the purpose of the form factor is to simply scale the point-like cross-section by some energy dependent factor. This is to account for the actually consisting of a collection of smaller point-like charges that each contribute to the scattering. Form factors are always the Fourier Transform of the charge density distribution.
where \(\rho({\bf r})\) is the charge density distribution, and \({\bf r}\) is the position. Based on our reasoning that the nucleus has some underlying distribution of charge the simplest model we could come up with would be a so called Top-Hat Distribution. That is, constant uniform density, falling to zero at the “edge” of the nucleus.
Note
It’s worth pointing out here that the Fourier transform of a delta function is just \(1\), so if the nucleus was indeed a point charge at the center, we would arrive at the same cross-section for a point-like target as before.
With this form factor relation we can plug in different possible charge distributions of the nucleus and see which one best fits the data. This means detailed measurements of the cross-section over different values of \(\bf q\) allow us to extract the underlying charge distribution. Importantly, during the early electron scattering experiments it was seen that at higher values of \(\bf q\) we start to see bumps or ridges in our measurements of the cross-section as shown in Fig. 2.1.
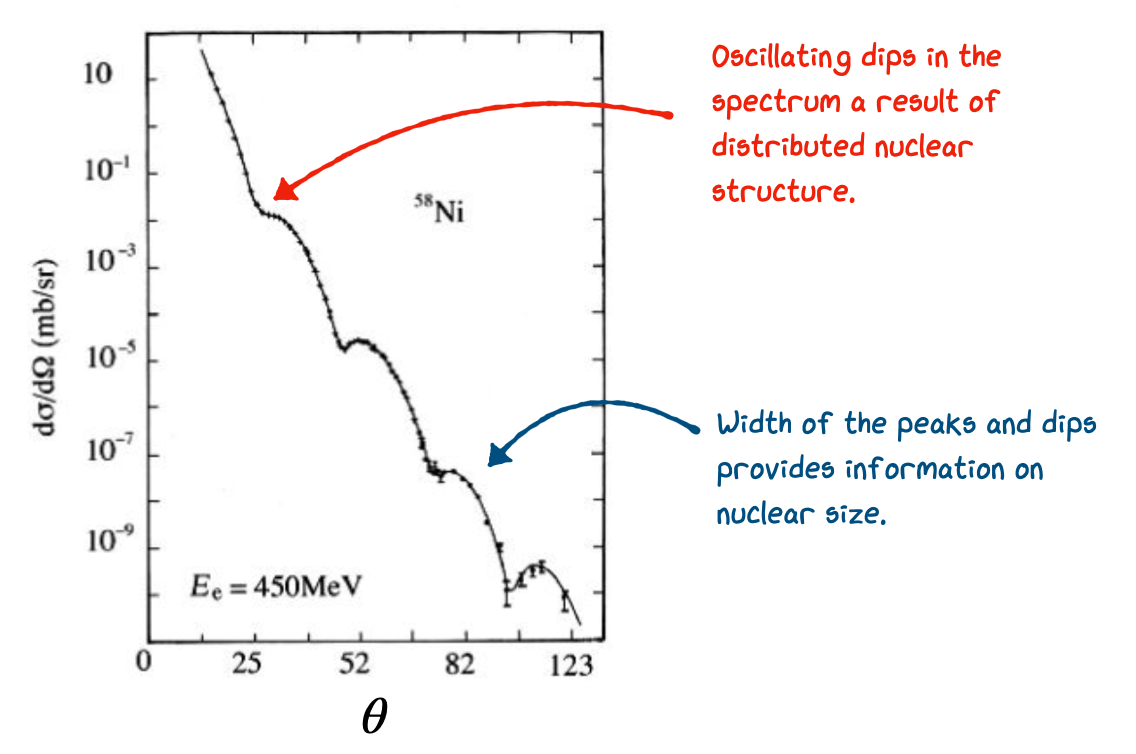
Fig. 2.1 Measured cross-section from electron scattering of nickel.#
Problem - Elastic Scattering Nickel
Explain where the dips come from in the elastic scattering data for nickel shown in the lecture notes. If the nucleus is assumed to be a solid uniform density sphere with a form factor given by
with \(b=qR/\hbar\), determine the momentum transfer of the first dip in the graph and use this to estimate the nuclear size.
Explain where the dips come from in the elastic scattering data for nickel shown in the lecture notes. If the nucleus is assumed to be a solid uniform density sphere with a form factor given by
with \(b=qR/\hbar\), determine the momentum transfer of the first dip in the graph and use this to estimate the nuclear size.
Core Knowledge
In this example we use Figure 2.1 of the notes which is from the textbook by Martin to estimate the radius of the 58-Ni nucleus.
The figure shows the differential cross section for the scattering of electrons of energy \(E_{e}\) = 450 MeV of a Nickel target as a function of the scattering angle. The plot shows a few dips that are not consistent with the scattering off a point-like particle, as the scattering off a point-like particle is described by the Mott formula, which is a monotonic function of the angle. This dip behavior is attributed to the presence of a form factor defining the nuclear structure.
Method
For the estimate of the nuclear structure we make the following assumption.
The scattering is elastic, e.g. the energy of outgoing electron is equal to the energy of the incoming electron.
This is justified, as the energy of the electron (450 MeV) is much smaller than the rest mass of the nucleus (around 55 GeV). Because of this the momentum transfer \(q\) is written as
where we’ve assumed that the initial and final momenta magnitude, \(p\), is constant due to elastic scattering.
This can be rearranged to get
We can therefore write that
The momentum transfer in a collision can be related to the scattering angle using the formula above
The first minimum can be read off the plot and corresponds to \(θ ≈ 24^{◦}\). Which means
Application
The shape of the nucleus is approximated as a solid sphere with uniform density. Using this approximation the form factor \(F(q)\) is written as
with \(b=qR/\hbar\). This standard formula is derived in the Martin textbook.
Under this approximation the form factor and the cross-section will be zero for a few values of \(b\). The fact that we do not observe a vanishing cross section means that the uniform density approximation is not exact. We can, however, take the position of the first minimum in the cross section as an indication of where the form factor would go to zero if the distribution was perfectly uniform. The first zero of the form factor corresponds to the value \(b_{1} = 4.49\).
Using the definition of b we have
Note that if we use the empirical formula for the nuclear radius we would have
which is remarkably close.
The shape of these structures we observe in electron scattering give an indication of something very close to a top-hat distribution in the center of nuclei, but also that a more “fuzzy” form is needed at the edges. A better fit to the data is given by a “Woods-Saxon” form which accounts for this edge. The Woods-Saxon potential modifies the simple top-hat by introducing a smooth edge parameterized in terms of the radius, \(r\), as follows:
\(\rho_0\) is an assumed constant density in the centre.
\(a\) is the “edge” of the nucleus defining the width of the top-hat.
\(d\) is the so-called Skin or Surface Thickness.
The same form applies for both the charge and density distribution with slightly different
The plot below shows the charge density versus distance \(r\) from the centre of the nucleus for several known nuclei. We see that as the nuclei size increases the “top-hat” part of the distribution just gets slightly wider but the skin thickness, which defines the fall of close to the edge of the nucleus, remains mostly constant.
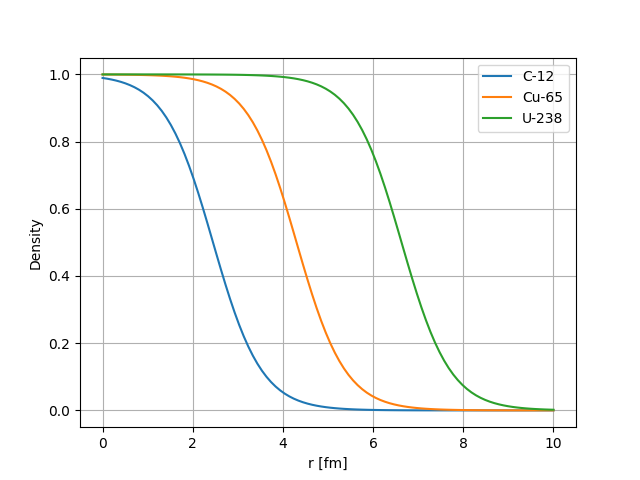
Fig. 2.2 Woods-Saxon charge distribution shape vs Distance from the center of the nucleus for several nuclei.#
Scattering experiments on many different nuclei have demonstrated that almost all, excluding exotic nuclei far from the line of stability, follow something close to this Woods-Saxon behaviour. Many nuclei sit on a straight line correlating average radius and nucleon count as shown below.
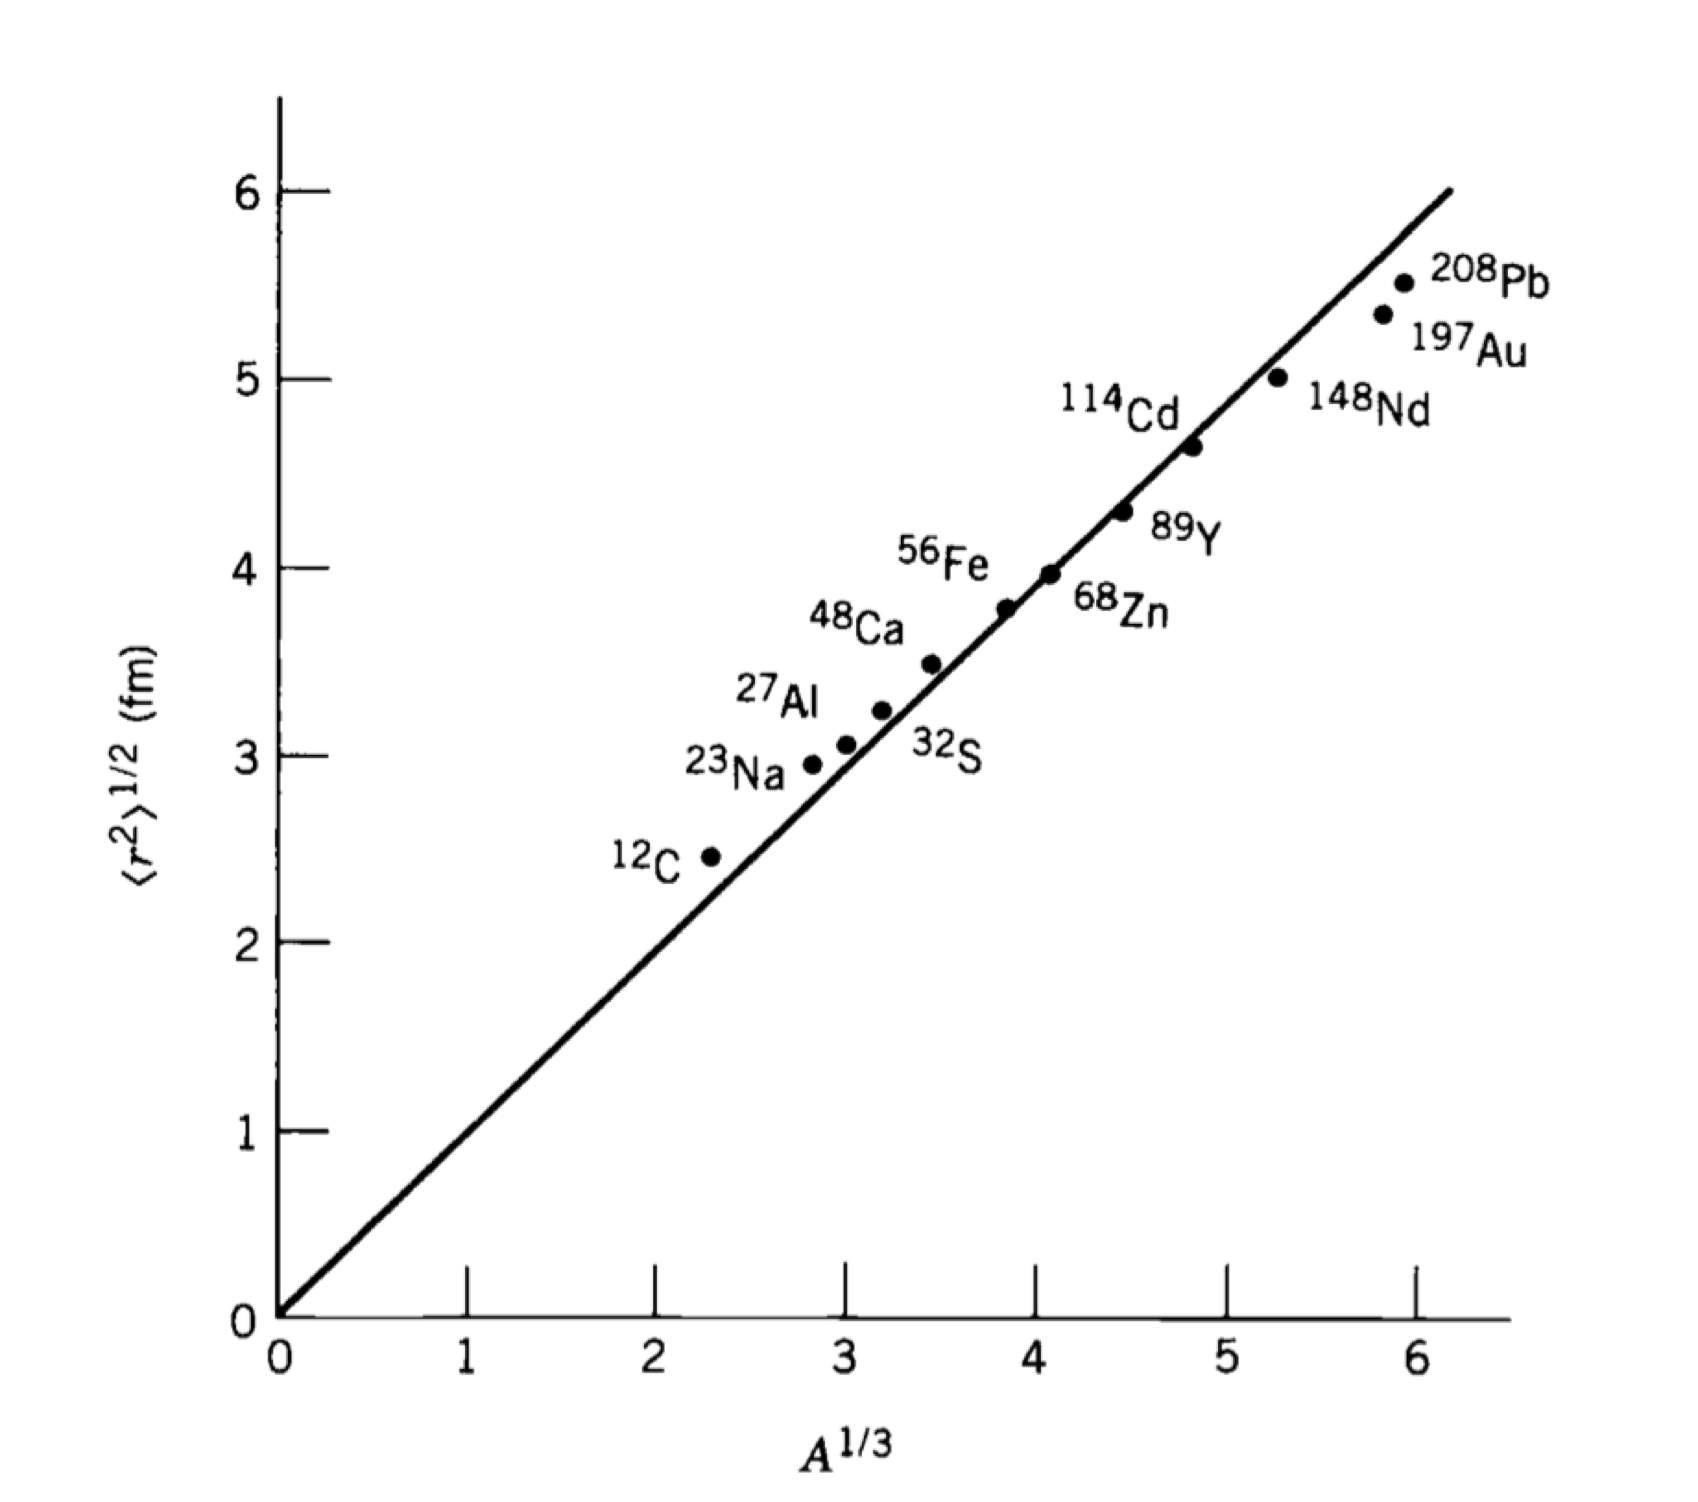
Fig. 2.3 Average nuclear radius for many nuclei as a function of atomic number.#
This gives the following relation for the average radius.
Typically, an official nuclear radius is considered that defines the maximum extent of the nucleus from the average radius above as
Problem - Nuclear Cutoff
Based on the idea of a hard nuclear cutoff derive the expression that relates the radius of the nucleus with the total nucleon number.
Based on the idea of a hard nuclear cutoff derive the expression that relates the radius of the nucleus with the total nucleon number.
The graph presented in the lecture of the root-mean-square (RMS) of the nuclear matter as a function of the atomic mass number \(A^{1/3}\) shows a fit to the data gives a parameterization
Under the assumption that the nucleus is a sphere or radius \(R\) and uniform density, the density would be
and
The quantity \(< r^{2} >\) is calculated as
where the integration over the angular coordinate was carried out to give a factor of \(4\pi\). Substituting the expression for \(ρ_{M}(r)\) we have
Therefore the nuclear radius is
Typical Values For the charge density distribution
\(a = 1.07 A^{1/3} ~\textnormal{fm}~~\textnormal{(radius)}\)
\(d = 0.54~\textnormal{fm}~\textnormal{ (skin thickness)}\)
\(\rho^0_{\textnormal{charge}} = 0.06-0.08~e~\textnormal{fm}^{-3}~\textnormal{ (average charge density)}\)
Note: We expect \(\rho^{0}\) to be lower for heavy nuclei as \(Z\) tends away from \(N\).
Typical Values For the mass density distribution
\(a = 1.2 A^{1/3} ~\textnormal{fm}~~\textnormal{(radius)}\)
\(d = 0.75~\textnormal{fm}~\textnormal{ (skin thickness)}\)
\(\rho^0_{\textnormal{mass}} = 0.17~\textnormal{nucleons fm}^{-3}~\textnormal{ (average mass density)}\)
Key observations for both models are:
Modifications are needed between mass distributions and charge distributions due to neutrons having zero-charge.
The parameter values are quite similar in both cases.
The charge radius and mass radius both scale as \(A^{1/3}\).
The central densities are constant, independent of how many nucleons there are in the nucleus.
\(\rho^0_{\textnormal{charge}}\) is approximately half \(\rho^0_{\textnormal{mass}}\) in agreement with our expectation that the nucleus is approximately evenly mixed with protons/neutrons.
Studies of electron scattering data found this generally gave a good fit across many nuclei. The last point on central densities is important as it backs up the fundamental assumption in nuclear physics we mentioned earlier - the Incompressible Nucleus.
Problem - Nuclear Density Estimate
Considering measurements of the charge distribution of nucleons for several nuclei shown in the graph below, determine an estimate of the mean nucleon density in nuclei.
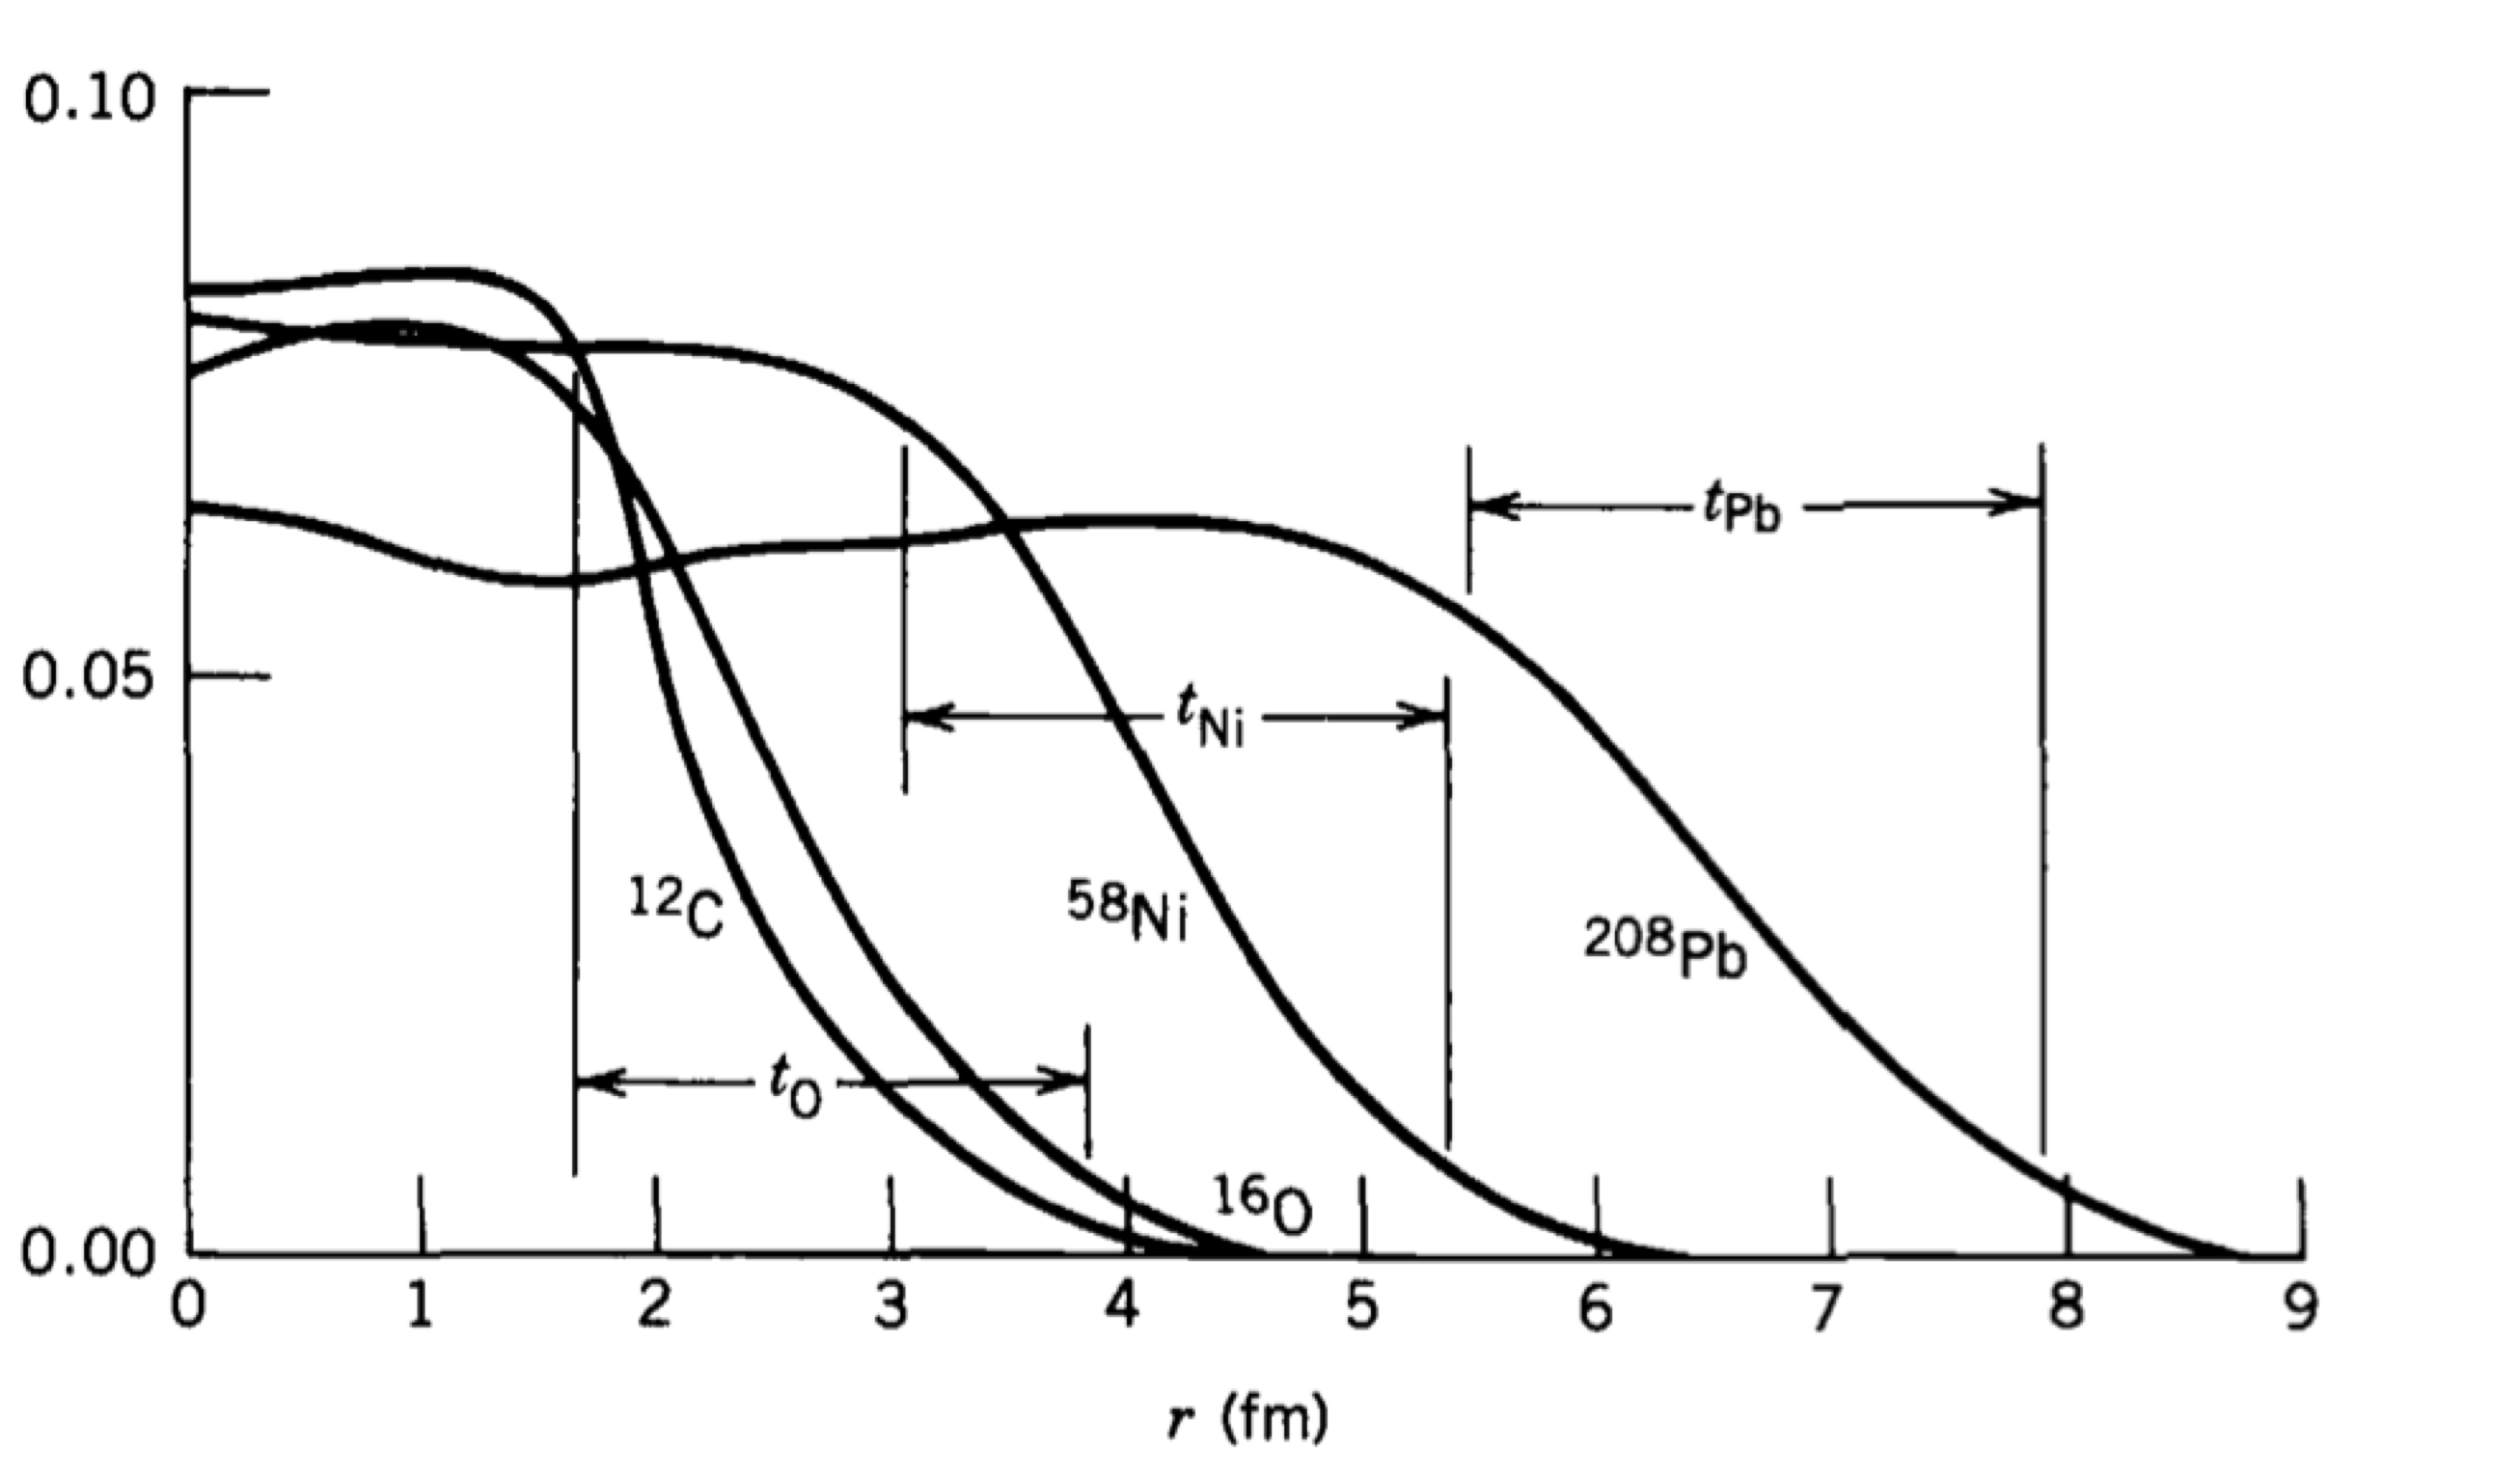
Considering measurements of the charge distribution of nucleons for several nuclei shown in the lecture notes, determine an estimate of the mean nucleon density in nuclei.
The graph presented in the lectures shows the Saxton-Woods distribution of the charge inside the nucleus. In this example we evaluate the density of nucleons inside the nuclear region for two nuclei: 12C and 208Pb.
We assume that the density of nucleons is proportional to the charge density and is given by
where we indicated with \(ρ_{nucl}\) the density of nucleons and with \(ρ_{ch}\) the charge density. We can read the plateau value of ρch off the graph for the two elements under consideration.
For 12-C we have \(ρ_{ch} ≈ 0.08~e\) which gives
For 208-Pb we have \(ρ_{ch} ≈ 0.06~e\) which gives
2.3. The Liquid Drop Model#
2.3.1. Introduction#
All the above early studies and information on the nucleus start to lead us towards some basic models to explain the behavior of nuclei. The most basic is the Liquid Drop Model (LDM), based on a description of the nucleus as a drop of “Nuclear Fluid” analogous to a water droplet.
The LDM arises from the following main observations:
Nuclei are spherical (in general) with central density having a fixed value independent of radius. i.e. no matter how many nucleons you pile in to make your nucleus bigger, the density remains the same, the nuclear fluid is Incompressible (like a water drop).
The observation that the radius (size) of the nucleus goes as \(R \sim A^{1/3}\).
The force binding the nucleons together appears to be short range - rather like the intra-molecular force in liquids.
The Binding Energy Curve suggests that whatever size of a nucleus, a nucleon situated inside has roughly the same binding energy as all other nucleons. It takes roughly the same energy to free it no matter how many other nucleons are present (neglecting proton/neutron mass differences as we will see later).
These four arguments allow us to build a simple model of the nucleus that satisfies all constraints - The Liquid Drop Model. The assumptions of the model are:
The forces between nucleons are; Repulsive at very short separations, Attractive at separations similar to particle size, and Negligible at larger distances. The collective attraction of nuclei is what keeps them bound together contributing a negative Volume Energy.
The centre of the nucleus is an Incompressible Nuclear Fluid with constant density which is independent of radius, and having a positive Surface Tension Energy. Assuming the fluid is non-rotating, in absence of other forces, the shape adjusts to minimize the surface tension energy resulting in a spherical shape.
If the drop carries Electric Charge then this is uniformly distributed throughout the drop. This combined with the Repulsive Force leads to an additional positive Coulomb Potential Energy in the nucleus.
Putting this together mathematically in the Liquid Drop Model (LDM) leads to an equation for the binding energy for the nucleus as
In line with our description we have three terms:
Note dividing B(A,Z) by the total nucleons A, gives us a prediction for the binding energy per nucleon plot we discussed in the last set of lectures.
By convention we talk about the binding energy as a positive value (e.g. \(52~\textnormal{MeV}\) for Carbon-12) when in fact it’s a negative value when considering all nucleons in the nucleus - energy needs to be added to the system for us to liberate a nucleon. The negative volume potential energy we expect when nucleons are pushed together therefore corresponds to a positive term in the binding energy estimate in the LDM equation.
To understand in a bit more detail the components of the LDM lets go through them one by one seeing how they improve our fit to real data. We’ll take the data from the International Atomic Energy Association (IAEA) database, and select only the most abundant nuclei with the highest binding energy for each possible value of \(A\). This is how the figures you’ve already seen for binding energy are actually made.
2.3.2. Energy Terms#
Let us go through in detail each of the typical contributions in the liquid drop model.
2.3.2.1. The Volume Energy Term#
This is the main term, its positive, associated with the short range forces between nucleons pulling them together, its the same for all nucleons (a constant), hence the total for a nucleus is just proportional to the number of nucleons \(A\).
The \(a_{V}\) term sets the scale of the energies we are dealing with in nuclear physics. It is typically a value close to \(a_{V} = 15.56~\textnormal{MeV}\). Once the other terms are included (subtracting from this Volume term) we find that a good typical value for the Binding Energy per Nucleon is about \(8~\textnormal{MeV/nucleon}\). We therefore expect the other terms to reduce the binding energy by around \(7-8~\textnormal{MeV}\).
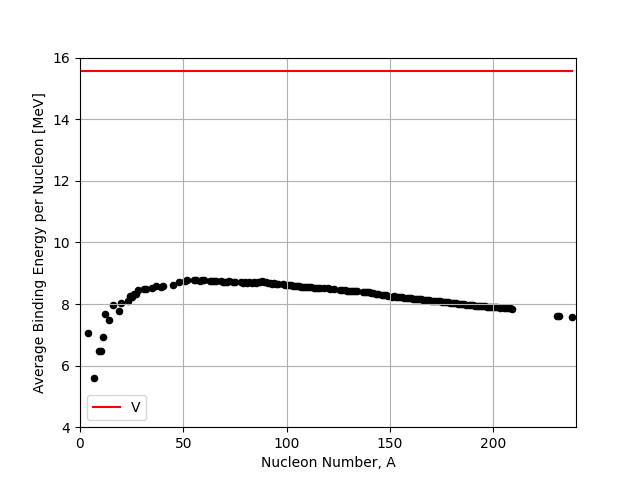
Fig. 2.4 Volume term (V) in the liquid drop model compared to the IAEA binding energy data.#
2.3.2.2. The Surface Tension Energy Term#
This is a correction to the Volume Term, subtracting from it, to allow for the assumptions that the outer nucleons near the surface will be less tightly bound. These nucleons make the nucleus weaker, so feel less of the short range attractive forces between nucleons compared to those nucleons inside. It’s like a surface tension term. It’s no surprise then that it is proportional to the surface area of the nucleus which scales as a factor of \(A^{2/3}\).
See here the effect of the surface term. It has the greatest effect on small nuclei, because they have a greater fraction of their nucleons near the surface compared to inside.
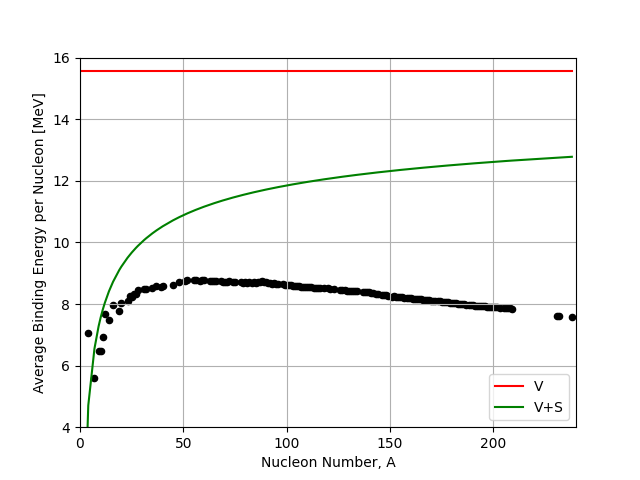
Fig. 2.5 Volume (V) and Surface (S) term in the liquid drop model compared to the IAEA binding energy data.#
2.3.2.3. The Coulomb Potential Energy Term#
This second correction to the Volume Term comes because nuclei contain positively charged protons that repel each other. This electrostatic repulsion also weakens the nucleus, hence a negative term, reducing the overall binding strength.
By assuming charges are distributed evenly in the spherical nucleus we can consider the repulsion that a shell of protons of thickness \(dr\) experiences due to the remaining charge inside the shell. Integrating the coulomb potential this shell experiences across the entire size of the nucleus gives an estimate of this repulsion for the Total Electrostatic Energy of
Problem - Coulomb Repulsion
Based on classical mechanics assuming a coulomb repulsion that occurs inside the nuclear medium, estimate the form of the coulomb repulsion term in the liquid drop model energy for a nucleus of given charge \(Z\).
Based on classical mechanics assuming a coulomb repulsion that occurs inside the nuclear medium, estimate the form of the coulomb repulsion term in the liquid drop model energy for a nucleus of given charge \(Z\).
Core Knowledge
Recall first that the electric potential energy of a charge \(q_{1}\) in the potential of \(q_{2}\) distance \(r\) away is:
The Charge Density (it is uniform remember) is given by :
Method
Based on this we see that the Electrostatic Energy in the shell \(dr\), we call \(dE_{e}\), is given by:
which reduces to
Integrating this out to the maximum radius of the nucleus, \(r=0\rightarrow R\), gives the total Electrostatic Energy:
Finally, if we substitute in the charge density given earlier we get
If we remember that the nuclear size is given by \(R=r_{0}A^{1/3}\) where \(r_{0}\) is the Nucleon Effective Radius and we gather the constants out we get
and
Application
This is close to our contribution we showed in the equations above, however the analysis includes a slight approximation. As charge is quantized the integration over \(r\) should really only start once a single charge has been enclosed. If this is accounted for the Total Electrostatic Energy is usually given by
The effect this has on our distribution is shown below. We can see that the coulomb term adds some noise to our prediction as it now depends on \(Z\) and at higher \(A\) the most stable value of \(Z\) can vary slightly from nuclei to nuclei.
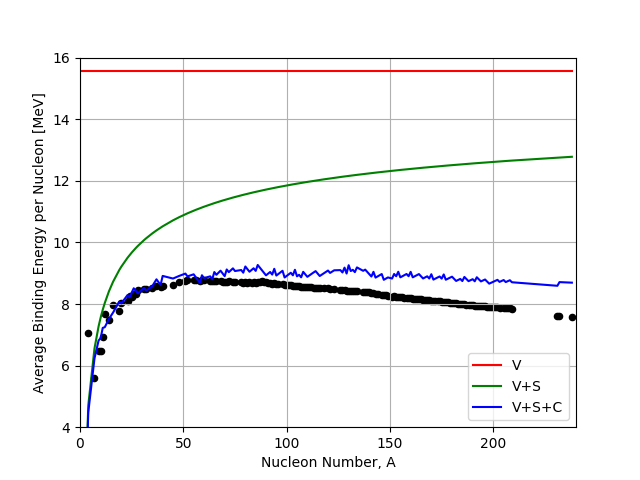
Fig. 2.6 Volume (V), Surface (S), and Coulomb (C) terms in the liquid drop model compared to the IAEA binding energy data.#
This change in shape due to the Coulomb Term is of fundamental importance in nuclear physics and has profound implications further on in this course. We see that the effect of the Coulomb Term is to bend the B/A curve down at higher A, yielding the peak in the B/A curve close to Fe-56, and producing a plateau where the addition of protons to the nucleus begins to make it more unstable.
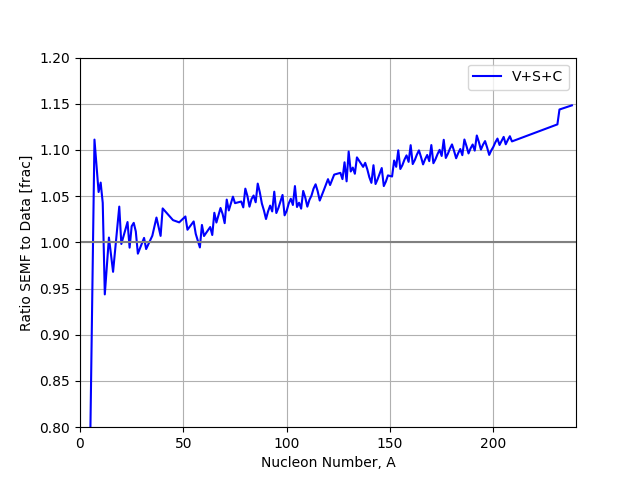
Fig. 2.7 Differences between three term liquid drop model and data.#
The basic LDM model as stated so far is pretty good but still does not fit the full average binding energy curve very well.
A clue to how to fix this comes from the other important plot shown in unit 1, the Chart of Known Nuclei.
As a reminder there were two important features:
The most stable nuclei lie roughly on a line where N=Z, nuclei that deviate from this tend to be less stable.
Nuclei for which the Z and/or N are an even number tend to be more stable.
Anything that tends to make nuclei less stable, implying the nucleons are less well bound together, is equivalent to lowering the average B/A value - we need to account for this. To do this we introduce two further terms which you may have seen before, the Asymmetry Term and the Pairing Term as follows:
At this stage we can regard both these new terms as arising empirically by observation from the data. Though you might guess that the physics origin comes from treating the nucleus using Quantum Mechanics. Note the negative terms - e.g. the more N deviates from the quality with Z, the more negative is the Asymmetry Term and the weaker bound is the nucleus (lower B/A).
2.3.2.4. Nucleon Pairing Term#
Although we can regard the Asymmetry and Pairing Terms as empirical, just an observation that fits the data, we can explain their form better by starting to introduce some Quantum Mechanics (QM). This will lead us later to an improved model of the Nucleus, the Shell Model.
Both protons and neutrons are Fermions, i.e. they have Asymmetric Wave Functions and spin=1/2. Thus they obey the Pauli Exclusion Principle. So we would expect that only two protons (or two neutrons) can occupy a given energy state, one with Spin-up, the other Spin-down. In fact the coupling of these spins means it is energetically favorable to have complete pairs of neutrons or pairs of protons, rather than an odd neutron or proton alone in a given level.
In the figure below each line corresponds to a new energy level that the protons or neutrons can occupy when the states below them are filled.
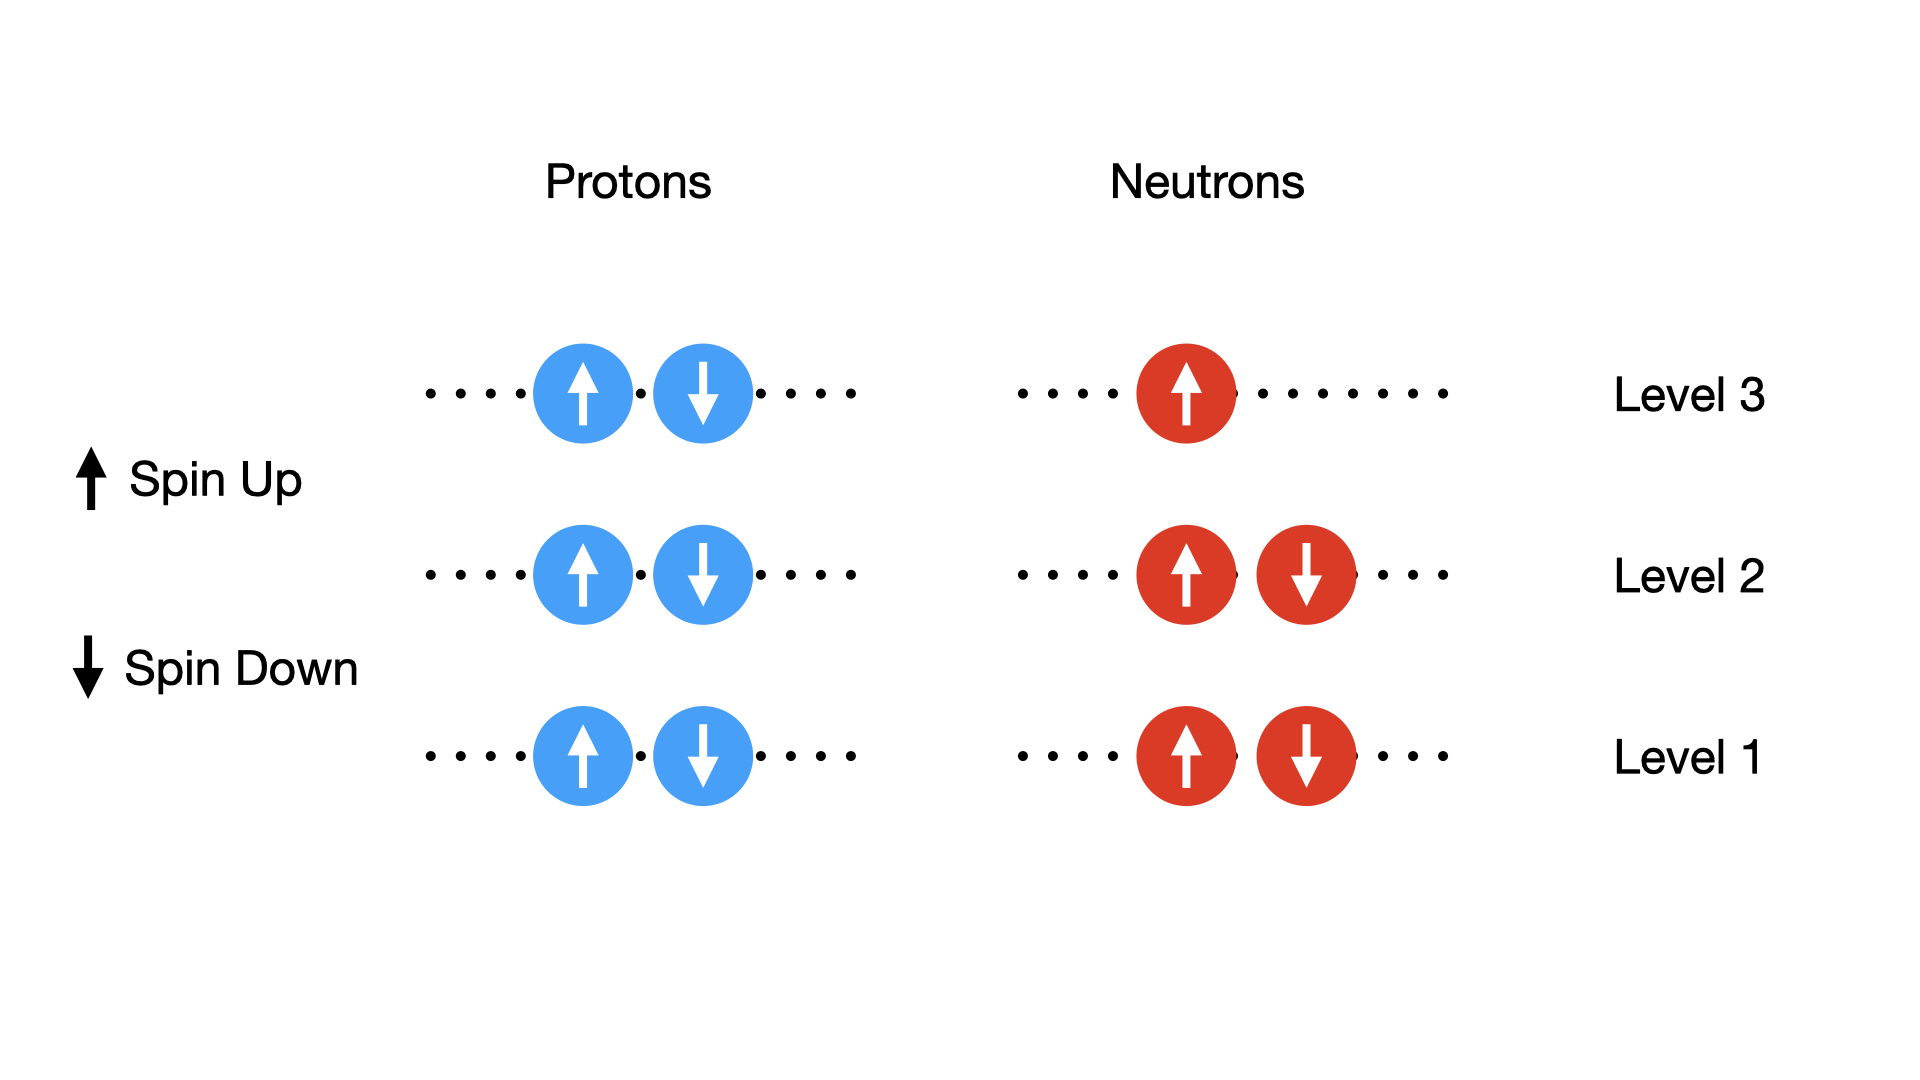
Fig. 2.8 Possible pairing states of protons, each possible energy state or ‘level’ can have two protons or neutrons inside it, provided their spins are opposite.#
We might expect that the neutrons and protons in a nucleus might pile into energy levels in pairs. If each sequential level has a higher energy, then most nucleons would pair up in the lowest energy levels as possible to give the most stable configuration. Based on this simple pairing idea there are three possible states
Even-Even Even numbers of protons and even numbers of neutrons would therefore yield the largest positive contribution to the binding energy. This is referred to as an Even-Even configuration, and is the most stable.
Even-Odd If we have a single left over proton, or a single left over neutron, we end up with only one partially filled energy level on the neutron or proton side respectively. This is referred to as an Odd-Even state and as a result the nucleus is less bound and in a state of intermediate stability. This is because the unpaired nucleon is not tightly bound.
Odd-Odd Finally we can consider states where both an odd proton and an odd neutron is left. These are referred to as Odd-Odd states. Because they are the least stable they are very rare in nature.
So, how nucleons pair up is incredibly important, as this dictates the \(\delta_{pair}\) term in the binding energy.
Note the negative term in the binding energy equation that cancels out the negative term in the Even-Even case to produce an increase in binding energy overall (the nucleus is more stable). The \(A^{-1/2}\) part is an empirical fit and the \(a_p\) factor is a constant. Its important to get the sign of the term correct.
2.3.2.5. Nucleon Asymmetry#
Finally, we also see that nuclei are also more stable if there are equal numbers of neutrons and protons.
In the simplest QM Model (an infinite 3D potential well) we can assume that spacing between the energy levels is a constant value and is proportional to the inverse of the volume hence \(\Delta E \propto A^{-1}\). A full derivation of this is beyond us at this point but if we were to do so it would yield the form
where \(a_{a}\) is another constant. Importantly this gives zero if \(N=Z\) as then \(A=2Z\).
If we look at how both the additional pairing and asymmetry terms in our model behave we see that they are capable of bringing us closer to the data. The asymmetry term makes the biggest difference at high \(A\), whilst the pairing term improves the model at low \(A\) and has smoothed out the fluctuations we saw at higher atomic mass. We can now predict the binding energies for most of the common nuclei to within a few percent which is not bad for a relatively simple model!
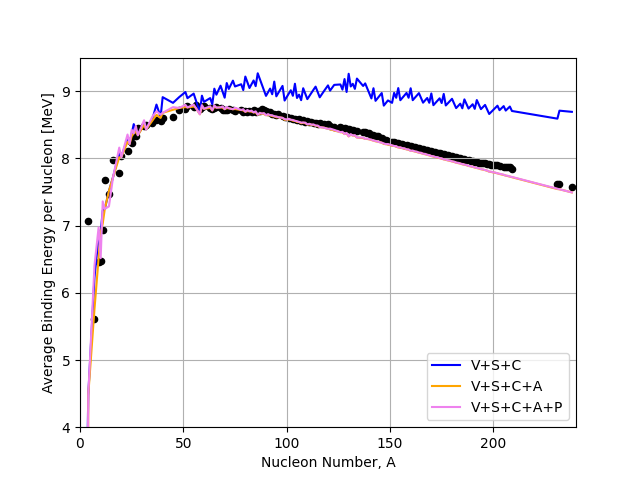
Fig. 2.9 Volume (V), Surface (S), Coulomb (C), Asymmetry (A), and Pairing (P) terms in the liquid drop model compared to the IAEA binding energy data.#
2.4. Total Liquid Drop Binding Energy Equation#
With all our terms added together we finally have a
or in terms of B/A for the plots above
where
\(a_{v} = 15.5 \textnormal{MeV}\),
\(a_{s} = 16.8 \textnormal{MeV}\),
\(a_{c} = 0.72 \textnormal{MeV}\),
\(a_{a} = 23.0 \textnormal{MeV}\),
\(a_{p} = 12.0 \textnormal{MeV}\),
\(\delta_{\textnormal{pair}} = \pm a_{p}A^{-1/2}\)
Warning
In several definitions you will find online and in text books the definition of the delta term and whether it is plus or minus in the top level equation will change. The key thing we need to remember is that EVEN-EVEN nuclei are more stable and therefore pairing term for these nuclei should always increase the binding energy.
This new equation for the binding energy can then be used to produce an estimate of any known nuclei mass using the Semi-Empirical Mass Formula (SEMF).
Whilst empirical in its form this is an amazing useful equation as it allows us to calculate of the energies of radiative emissions by estimating the initial and final state masses. For example, let’s say we consider a nuclear reaction such as alpha decay
We can use the SEMF to calculate the total rest energy of each component object in MeV, and what we find is that there is a mass deficit which ends up being distributed between the daughter nuclei and the alpha particle in the form of kinetic energy. Due to conservation of momentum the alpha particle carries away most of this energy so our liquid drop model can be used to estimate the energy of alpha decay emissions for different nuclei.
Some example problems using the SEMF for calculating differences in binding energies are below.
Problem - Mirror Nuclei SEMF
Consider the nuclei 15-O and 15-N. Evaluate the difference in mass energy between the two nuclei using the SEMF and comment on why you would expect such a difference.
We note that for each nuclei we have \(A=15\), it is just the number of protons or neutrons that are swapped as Oxygen has 8 protons, and Nitrogen has 7. These are therefore Mirror Nuclei.
If we want to evaluate the difference in mass energy between the two nuclei we can simply subtract the mass calculated for each one using the SEMF. Before we do this however it’s worth evaluating which terms in the liquid drop model for binding energy actually contribute. The volume term and surface tension term only depend on \(A\) so both these terms cancel out if we take the difference as \(A\) is constant. Both nuclei are also Even-Odd (as \(A\) is odd) so that means the delta term also goes to zero. Therefore only the Asymmetry and Coulomb correction term contribute.
We can take this one step further because a quick evaluation of the Asymmetry term gives us
15-O : \(a_{a} (15 - 2 \times 8)^{2} = a_{a} (-1)^{2} = a_{a}\)
15-N : \(a_{a} (15 - 2 \times 7)^{2} = a_{a} (1)^{2} = a_{a}\)
The result is therefore that the asymmetry term will also cancel out, so any differences between the nuclei will mainly be down to the Coulomb term.
If we evaluate the difference in binding energy we get
Rearranging this it becomes
We expect our binding energy terms to just be dominated by the difference in coulomb terms we therefore get
Substituting this in with the difference in mass between protons and neutrons we get
So we find that actually there is an increase in overall mass energy (so a lower binding energy) for oxygen compared to nitrogen despite the fact that there are more protons (which are lighter than neutrons). This is because our Coulomb repulsion term contributes much more than the mass difference of a proton and neutron reducing the overall stability of the nucleus as we add protons.
Note that its also possible to do this assuming the \(Z^{2}\) instead of \(Z(Z-1)\) Coulomb term that is sometimes considered in the literature instead. If you do so you’ll end up with a different energy (by around 7%) but the conclusions are still the same.
2.5. Conclusion#
The Semi Empirical Mass Formula or Binding Energy Equation gives an excellent fit to the overall shape of the Binding Energy Curve and starts to give us the basis of a model for nuclei and how they behave. However, it has its failings.
SEMF Advantages
It makes good predictions of the masses and binding energies of most nuclei and explains the basic shape of the Binding Energy (BE) Curve.
It allows predictions of the energy release in nuclear decay (or energy input needed to make a reaction occur)
It suggests, for instance, why fission can occur in nature due to changes in the binding energy for fission parents and daughters.
SEMF Disadvantages
It does not explain why there are spikes in the BE curve at certain nuclei.
It doesn’t explain nuclei shape, in particular why some are observed to not be spherical.
It doesn’t explain nuclear properties like Nuclear Spin, Parity, and Magnetic Moment.
Later on in this course we’ll see how the SEMF is suitable for doing a lot of different radioactive decay and fusion/fission calculations, but in the next topic instead we’ll try to address some of these underlying weaknesses of the model to better understand the true nature of the nucleus.
Key Learning Review
Form factors can be used to account for the spatial distribution of charges inside the nucleus in scattering experiments.
Data has shown that the nucleus typically has an incompressible core, with a “fuzzy skin” outer layer that can be described by a Woods-Saxon distribution.
The nuclear radius follows an \(A^{1/3}\) scaling relation.
The liquid drop model, with volume, surface energy, coulomb terms, models the nucleus as an incompressible charged nuclear fluid.
Nuclei are more stable when protons and neutrons are in spin-up/down pairs, and have similar neutron and proton numbers.
The semi-empirical mass formula accounts for pairing and asymmetry seen in nuclei to estimate the total nuclear mass for all known nuclei, and does reasonably well!
The SEMF does not take in to account shell closures, and only approximates quantum mechanical behaviour.