
Chapter 1: Properties of Light#
Introduction#
The only information we have about our Universe comes from the light emitted by objects within it. A good understanding of light is essential in all of astrophysics. We must learn what light is and how it behaves. We must understand it’s properties, and learn how to use those properties to discover the information we seek. Finally, we must understand how light interacts with the matter around it. Much of the rest of the astrophysics course at Sheffield deals with what we know. By covering the basic physics of light, this course aims to explain how we acquire that knowledge. Our starting point is a question which seems quite simple; “what is light”?
The wave nature of light#
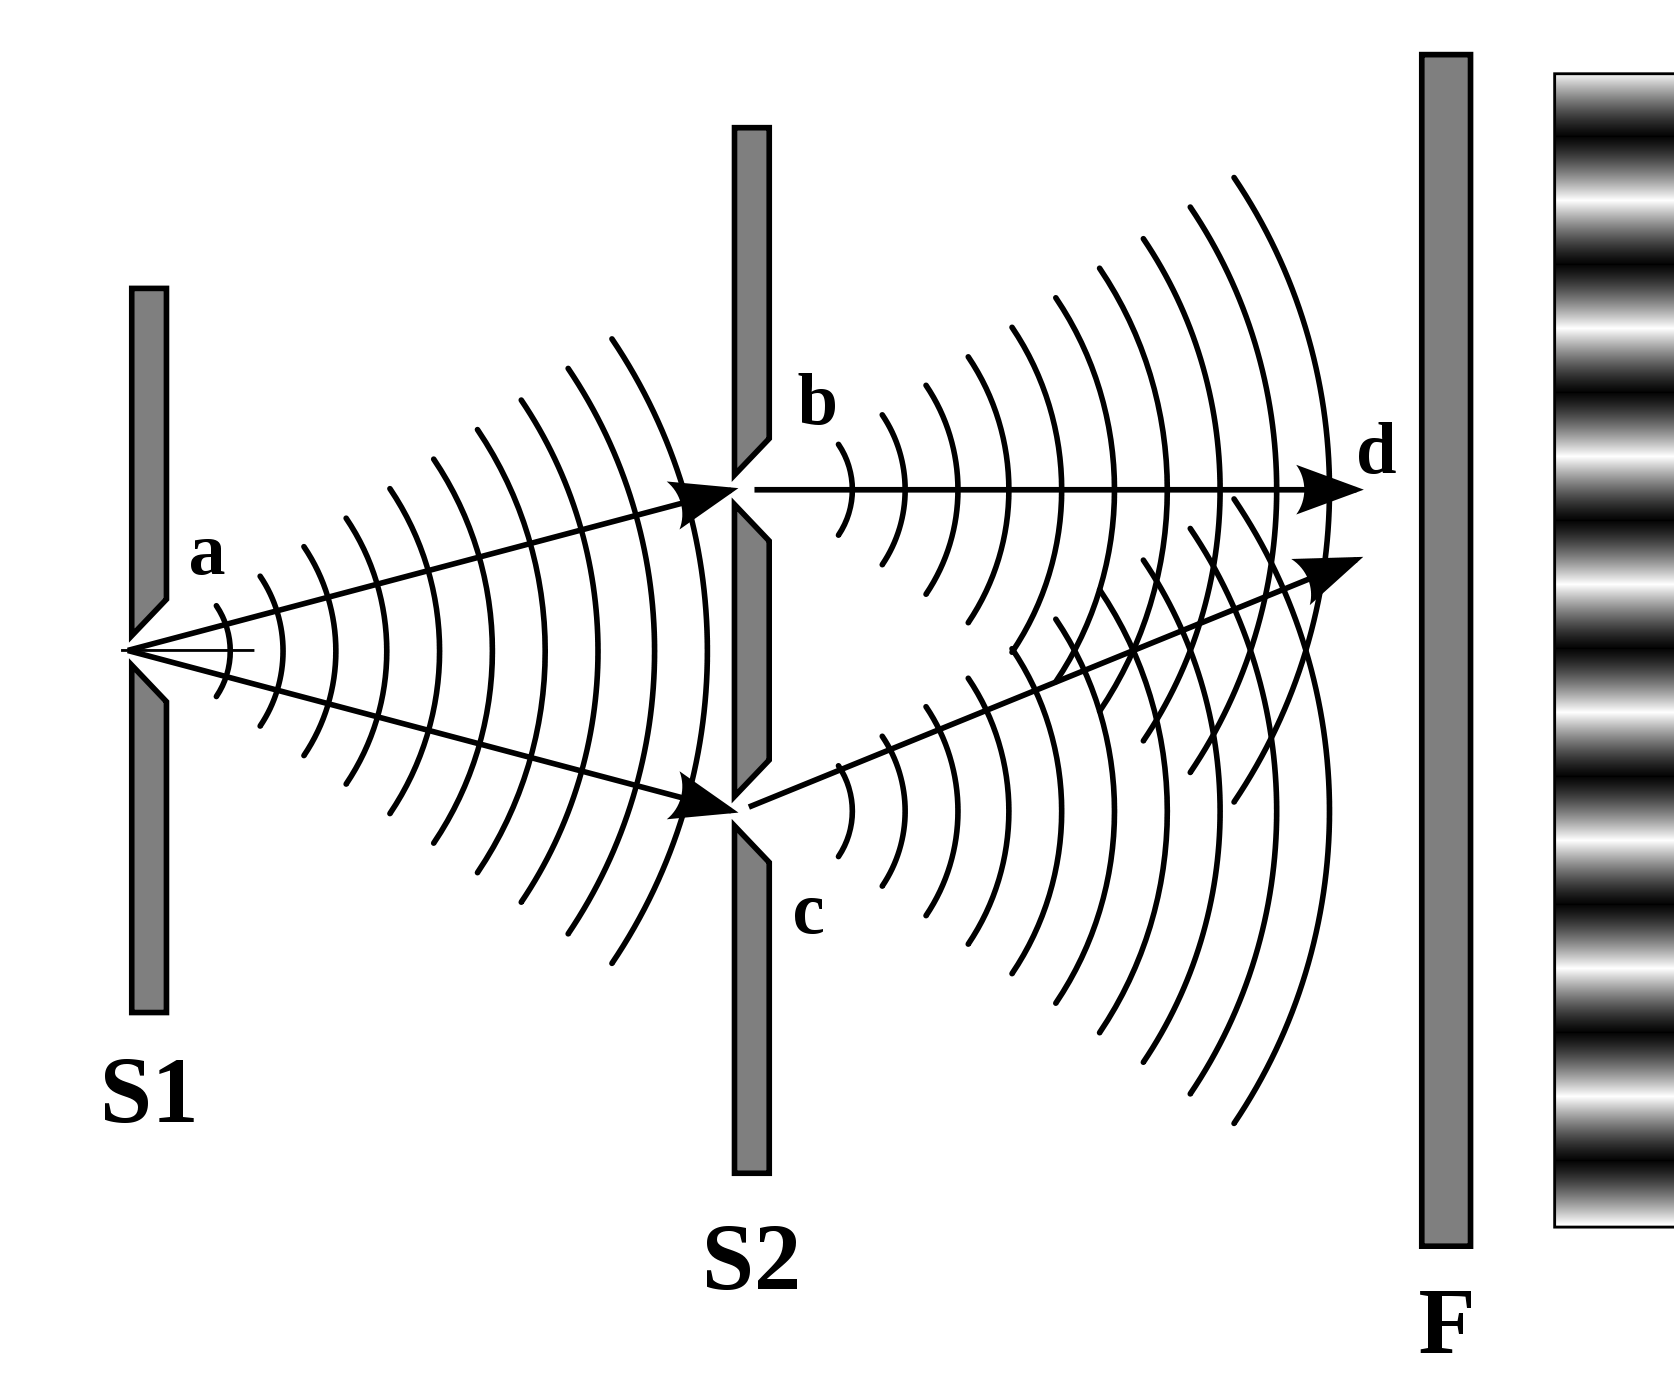
Fig. 1 Left: A schematic of the Young’s double slit experiment. A light source behind S1 illuminates the two slits at S2. These slits act as secondary sources of light, and light waves spread out from the slits like water waves on a lake. Right: the principle of superposition. Light in phase adds to give brighter light, but light which is out of phase cancels out to produce dark regions.#
It is easy to demonstrate that light behaves like a wave. The famous Young’s slit experiment is an elegant demonstration, and is shown in the left-hand side of figure 1. In this experiment, a thin plate with two parallel slits are illuminated by a single light source, and the light passing through the slits strikes a screen behind them. When we look on the screen, we see a diffraction pattern, made up of a series of bright and dark fringes. The diffraction pattern is easily understood if we think of light as a wave propagating through some medium, like water waves on a lake. In our experiment, each slit acts as a source of light waves; a wavefront of light spreads out from each slit. The two wavefronts of light hit the screen, and the brightness of light at that point depends on how the wavefronts interfere. If the light waves are in phase (if the peaks of both waves line up), then we get a bright region. If the two waves are out of phase (the peak of one wave corresponds to a trough in the other), the light waves cancel out, and we see a dark region (see RHS of figure 1).
We will return to the wave nature of light in a moment, but first let us look at the startling property of light that emerges from quantum mechanics.
The particle nature of light#
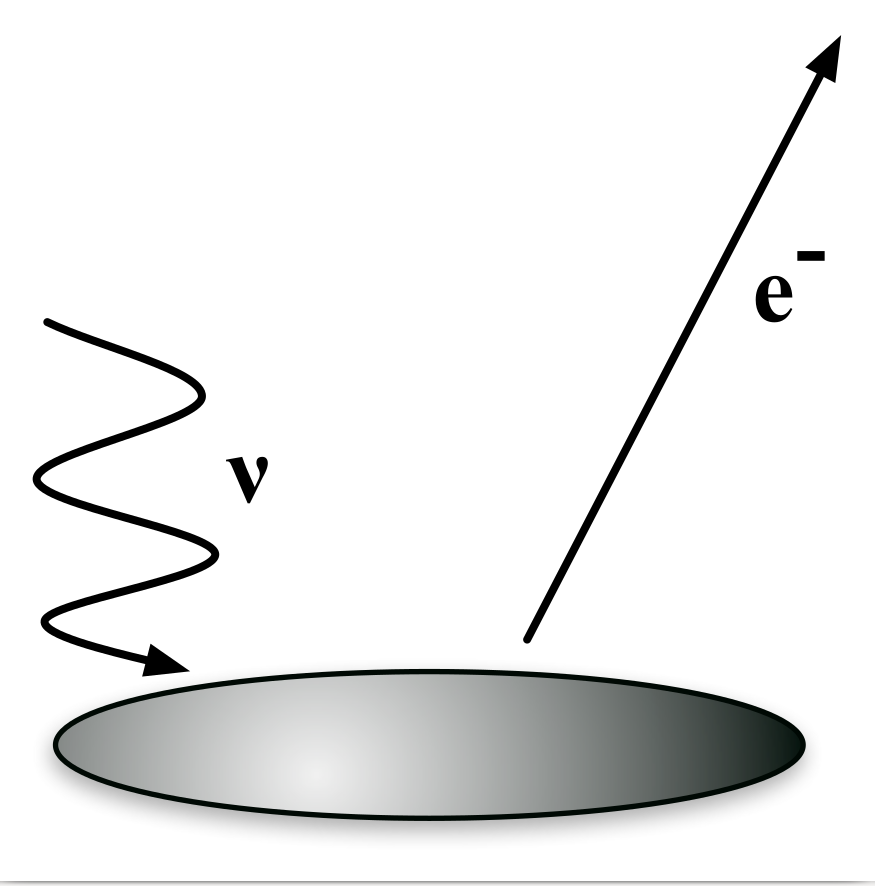
Fig. 2 Photoelectric effect diagram#
Photoelectric effect
Whilst it is easy to demonstrate that light behaves like a wave, it is also possible (though nowhere near as easy!) to demonstrate that light behaves like a particle. When a metal plate is illuminated with blue or ultraviolet light, electrons absorb the energy from the light, and can escape from the metal. This phenomenon is known as the photoelectric effect. If light is a wave, we might think that the energy of the escaping electrons would increase as the intensity of light increased, but the frequency of that light wouldn’t matter. In fact, the energy of the released electrons increases in proportion to the frequency of the light, and below a certain frequency, no electrons are emitted from the metal at all (see Figure 2). It is extremely difficult to explain this result by thinking about light as a wave.
The photoelectric effect’s dependence upon frequency was predicted by Einstein, in 1905, based upon a model of light as particles of light, called photons. He suggested that each photon has an energy which is proportional to its frequency,
\(E = h\nu\).
An electron requires a certain amount of energy to free it from the metal. If we call this amount of energy \(W\) (known as the work function) then the energy of the freed electron should be given by \(E_{\nu} = h\nu - W\). Thus, the energy of the emerging electron is proportional to the frequency of the incident light, just as we see in the photoelectric effect. What happens if the frequency of the light is reduced, so that the energy carried by the photons is less than \(W\)? In this case, no single photon has enough energy to liberate an electron, and so no electrons can escape the metal. These were the predictions made by Einstein for the behaviour of the photoelectric effect. Einstein’s predictions of the frequency dependence of the photoelectric effect, based upon the photon model, were confirmed in painstaking experiments by Millikan in 1913-1914. Although Millikan didn’t believe in the particle nature of light at the time, his experiments earned him the Nobel prize, and gave tremendous support to the picture of light as discrete particles of light.
The photoelectric effect tells us that each photon has an energy given by \(E=h\nu\). Photons also have a momentum, given by \(p=E/c=h\nu/c\), although to understand why requires us to study Einstein’s theory of special relativity, which is beyond this course.
The wave-particle nature of light#
So we have some experiments which show that light behaves as a wave, and other which show quite clearly that light behaves as a particle. In fact, there are even experiments that show that light can behave as both a particle and a wave at the same time! We are going to go back to the Young’s slit experiment described earlier, but perform an experiment in which we reduce the intensity of the light so much that only one photon illuminates the plate with the slits at any one time. Now, let us put a special camera in place of the screen, that can detect each photon as it arrives at the screen. What we find is astonishing. The light is clearly behaving like photons, because we see each one hit the screen individually. The location of each photon as it hits the screen is seemingly random; one photon arrives at a given location and a moment later another photon arrives somewhere else. Over time, however, as we watch the photons arrive one-by-one, we find more photons are hitting the screen where the bright regions of the original diffraction pattern were! How can this be? The diffraction pattern was made by the interference of waves of light. The photons are going through the slit one-by-one and so cannot be interfering with each other. What is going on is that the photons are interfering with themselves; behaving as a particle and a wave at the same time. Thus, whilst light sometimes behaves as a wave, and sometimes as a particle, in reality it is neither. The true nature of light is much stranger, and is given by quantum mechanics, which you will study later in the Physics course. In the remainder of this module, we will choose to describe light as either a particle or a wave, depending on which suits us most!
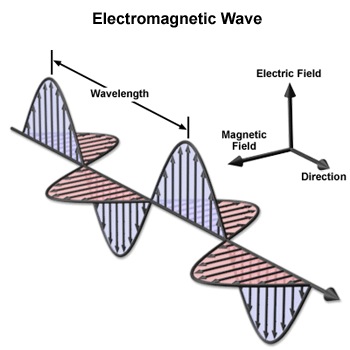
Fig. 3 An electromagnetic wave.#
Electromagnetic waves
The electro-magnetic spectrum#
If light is a wave, what is it a wave in? The answer is that light is an electro-magnetic wave. Modern theory describes light as electric and magnetic fields which oscillate in phase, perpendicular to the velocity of propagation, but in planes oriented at 90 degrees to each other. Confused? Have a look at figure 3.
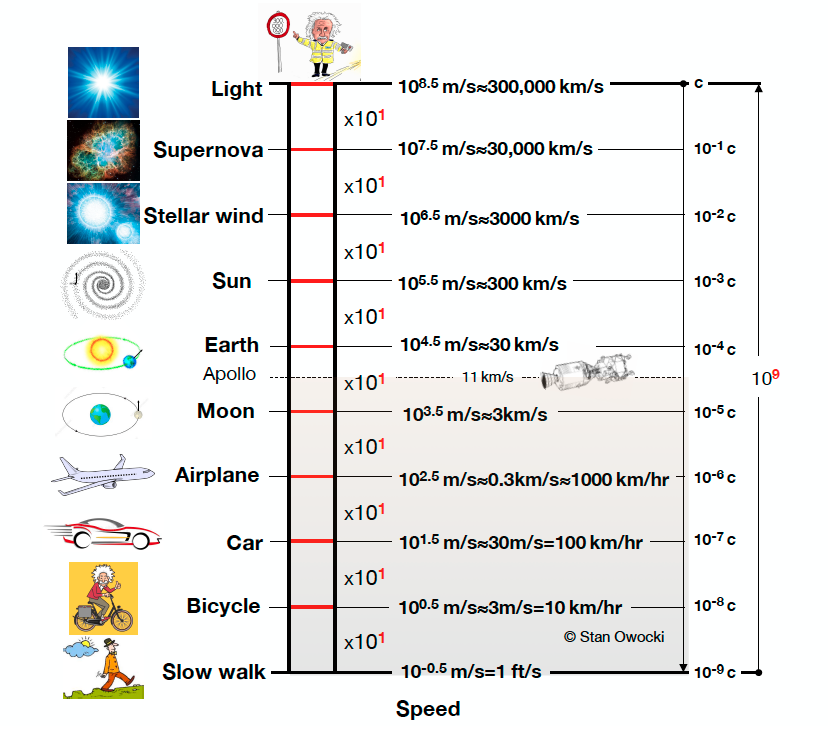
Fig. 4 The speed of light compared with more familiar speeds. Courtesy Stan Owocki (Bartol).#
The speed of light compared to more familiar speeds
Like any wave, it’s speed of propagation is given by the wave equation, \(c = \nu \lambda\), where \(c\) is the speed of light, ν is the frequency, and λ is the wavelength of the light. The speed of light is a very big number with respect to speeds that we are used to in our daily lives, as illustrated in Figure 4. Light of different frequencies is referred to by different names; visible light is only a tiny portion of the electro-magnetic spectrum, which is shown in figure 5. In astronomy one of the most useful techniques available to us is to exploit the full electro-magnetic spectrum. Because light is described both by the wave equation (\(c = \nu\lambda\)) and by \(E=h\nu\), we can describe a position on the electro-magnetic spectrum by wavelength, frequency, or energy. Visible light (frequencies around 1015 Hz) tells us much about the thermal emission from stars and galaxies, but infrared and microwave radiation (wavelengths from 1 micron to 1 cm) can show us the location of very cool stars and dust, whilst high-energy radiation (γ-rays, X-rays and UV emission) tells us about the most energetic processes in the Universe.
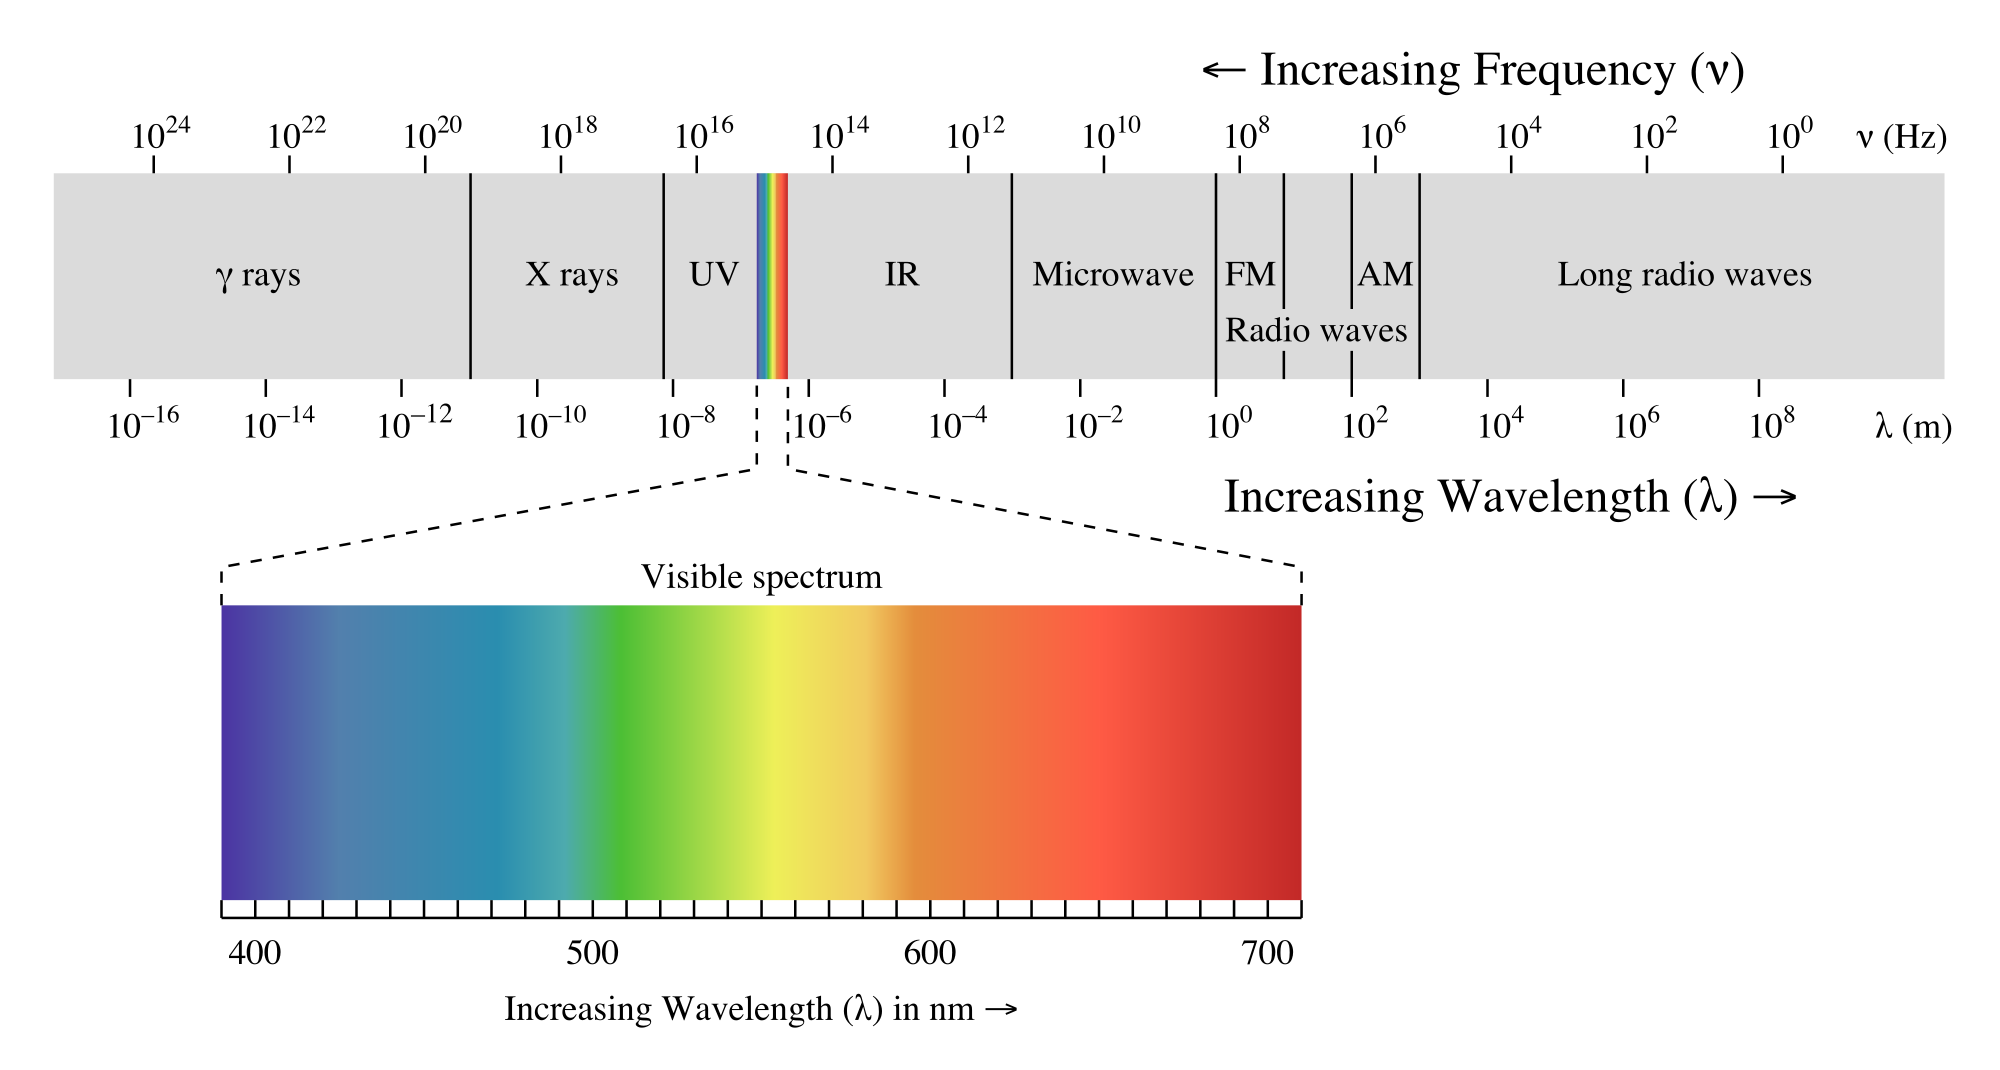
Fig. 5 The electromagnetic spectrum, showing the position of visible light.#
Electromagnetic spectrum
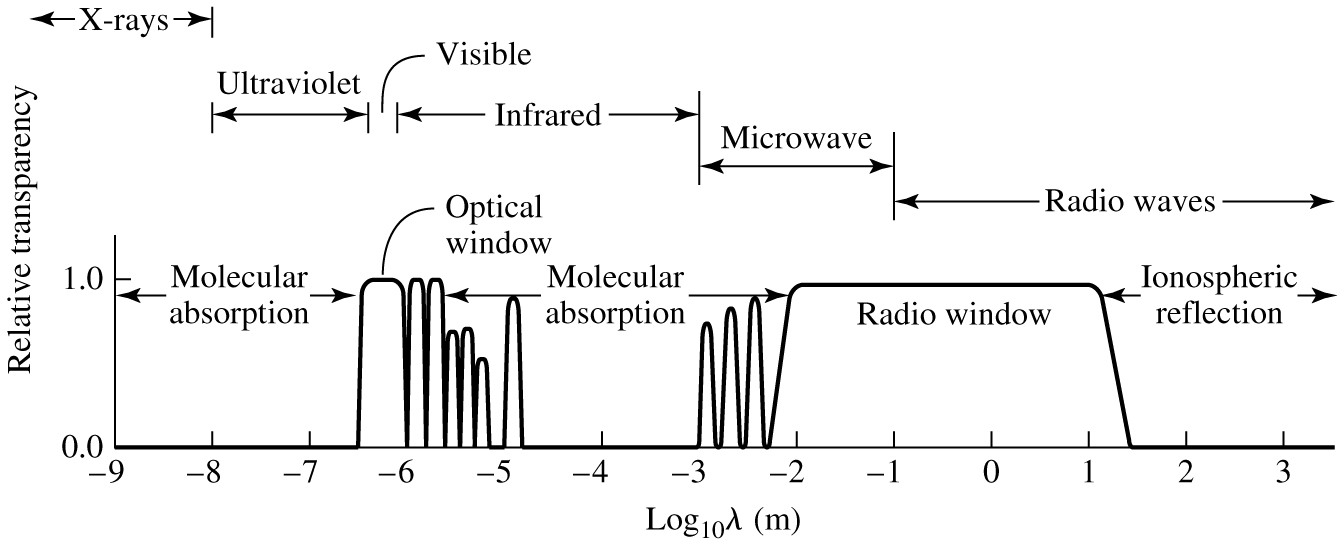
Fig. 6 Transparency of the Earth’s atmosphere.#
Transparency of Earth’s atmosphere
Only a small portion of the electromagnetic spectrum is observable from the surface of the Earth, however. The optical, infrared and radio portions of the spectrum are visible through atmospheric windows, but the Earth’s atmosphere is opaque to other wavelengths of light. The transparency of the Earth’s atmosphere is shown in figure 6. Regions of the electromagnetic spectrum not visible from the Earth must be observed from satellites in space; there now exist satellites which cover most of the electromagnetic spectrum.
Measuring Light - Brightness#
The most basic thing we can measure about the light from an astrophysical object is it’s quantity. How much light is emitted from a star. To do this usefully we need to define some quantities. The first is the monochromatic flux. This is the energy falling on a unit area, per unit time, at a given frequency. Actually, we need to be careful how we state that last part, “ at a given frequency”. In the same way that no light falls on a single point, because a point has no area, no light is emitted at a single frequency. Instead, we should properly ask how much light is emitted in a infinitesimally small range of frequency, \(d\nu\). Suppose we have a perfect telescope, which detects all the light that falls on it. The collecting area of this telescope is \(\Delta A\). Suppose we tune that telescope so it is only sensitive to light over a frequency range \(\Delta\nu\), and collect light for a time interval of \(\Delta t\). We detect an amount of energy given by \(\Delta E\). The amount of energy detected per unit time, area and frequency is then given by \(\frac{\Delta E}{\Delta t\, \Delta A\, \Delta\nu}\). To find the monochromatic flux, we must let all these intervals become infinitesimally small. In other words, the monochromatic flux is given by
As well as the monochromatic flux, which measures the amount of light as a function of wavelength, we may want to know the amount of light across all wavelengths. This quantity is known as the bolometric flux and is given by
Monochromatic flux in more detail#
Above we talk about the monochromatic flux, and we define it as the amount of energy detected per unit time, area and per unit frequency. It is given the symbol \(F_{\nu}\). We can also define a monochromatic flux as the amount of energy detected per unit time, area and per unit wavelength. We give this a symbol \(F_{\lambda}\). How are the two related? Over a small frequency range \(d\nu\), what is the total energy received per unit area and time? It is an amount equal to \(F_{\nu} d\nu\). Clearly, this amount of energy doesn’t change, whether we measure the monochromatic flux in wavelength or frequency units. Using this fact, we can write
where \(d\lambda\) is the small wavelength range that corresponds to the frequency range \(d \nu\). We can find \(d\lambda\) from
We take the modulus of \(d\lambda / d\nu\) because we only care about the size of the wavelength range \(d\lambda\). Let’s substitute equation (2) into equation (1) to get
.
This is our answer; an equation linking \(F_{\lambda}\) and \(F_{\nu}\). You might be wondering how we can calculate \(\left| \frac{d\lambda}{d\nu} \right|\), but in fact it is rather simple, because λ and ν are related via the wave equation, \(c = \nu\lambda\). Re-arranging, and differentiating this equation we find
which gives
Luminosity#
Whilst the flux is generally what we can measure from the Earth (or just above it), what we would often like to be able to measure is the total energy emitted by the source (in all directions). This is known as the luminosity and is a fundamental property of the source. The monochromatic luminosity is defined as the energy emitted by the source in unit time, per unit wavelength, i.e.
Just as flux has a monochromatic and bolometric definition, we can also define the bolometric luminosity, which is the total energy emitted by the source per unit time, at all wavelengths,
Inverse Square Law#
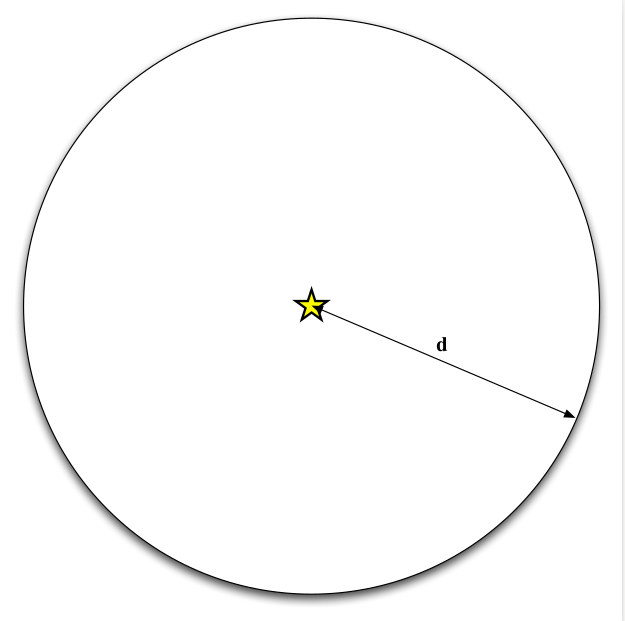
Fig. 7 Geometry for proving the inverse square law.#
Inverse square law
How are the luminosity and flux related? Consider a sphere at a distance d from the source (shown in figure 7). Assuming the source is isotropic, the energy from the source is evenly spread over the surface of sphere of radius d; the energy is spread over an area \(4\pi d^2\). The total amount of energy emitted per unit time is the bolometric luminosity, \(L_{\rm Bol}\). Therefore, the total energy arriving at the sphere, per unit time and per unit area (the bolometric flux) is given by the inverse square law
A similar equation can be written relating the monochromatic flux and luminosity, \(F_{\nu}\) and \(L_{\nu}\).