
Chapter 7: A brief history of astronomical spectroscopy#
Spectroscopy is the task of measuring the amount of light as a function of wavelength. When taking spectra of astronomical objects, we are measuring the monochromatic flux as a function of wavelength. The history of spectroscopy in general, and spectroscopy in astronomy and astrophysics are closely linked. A continuing theme throughout the history of spectroscopy has been that new technologies have allowed scientific breakthroughs. So the best place to start is with Isaac Newton, and the technology that allowed spectroscopy in the first place; the prism.
Isaac Newton and the nature of light#
When Isaac Newton started studying light, it was already well known that a beam of light, shone through a prism, would split into many different colours. At the time, it was believed that white light had no colour, and the prism itself caused the light to have colour. Newton showed that this wasn’t true with a very clever experimental setup (see figure 1).
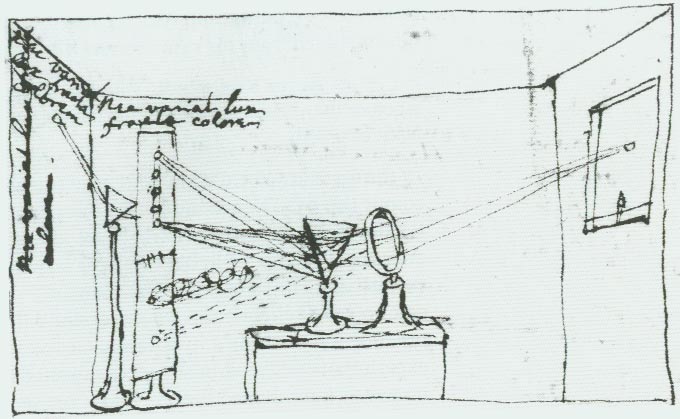
Fig. 30 Newton’s sketch of his experiment in the nature of sunlight, which he called his crucial experiment.#
Newton’s double prism experiment
In 1672, Newton shone window light through a prism and showed that the white light split into many colours. Then, he isolated the red light from this beam and passed this through a second prism (figure 30). The red light remained unchanged. This proved that white light was made up of coloured light, and the prism merely split the white light up into it’s constituent colours. The prism was to remain the spectroscopic tool of choice for nearly 200 years.
Wollaston and the dark bands in sunlight (1802)#
Newton’s experiments were some of the first spectroscopic observations of a star (the Sun). It wasn’t until 1802, however, that William Wollaston showed that sunlight was not simply a continuous spectrum. Wollaston was a chemist principally, but he was also very interested in optics. He invented the first camera lens, and also the Wollaston prism, used for measuring the polarisation of light. His prisms were of much higher quality than Newton’s, and they allowed him to see for the first time that sunlight was not an unbroken, continuous spectrum. Instead, there were several prominent dark bands which he observed. Wollaston believed that these dark bands were “gaps” in the colours of the Sun.
Joseph von Fraunhofer#
Fraunhofer was a Bavarian, orphaned at the age of 11, when he went to work as an apprentice to a glassmaker. At the age of 14, Fraunhofer was involved in an accident when the workshop he was in collapsed. In a bizarre twist of fate, he was rescued by the Bavarian prince, Maximilian IV Joseph, who took an interest in Fraunhofer’s life, providing him with access to books, time to do research and glassmaking materials.
Fraunhofer became probably the best maker of optics in the world. He discovered the dark bands in the Sun’s spectrum, independently of Wollaston, in 1814. In total, he found 574 dark lines, which are named after him; the Fraunhofer lines (see figure 31).
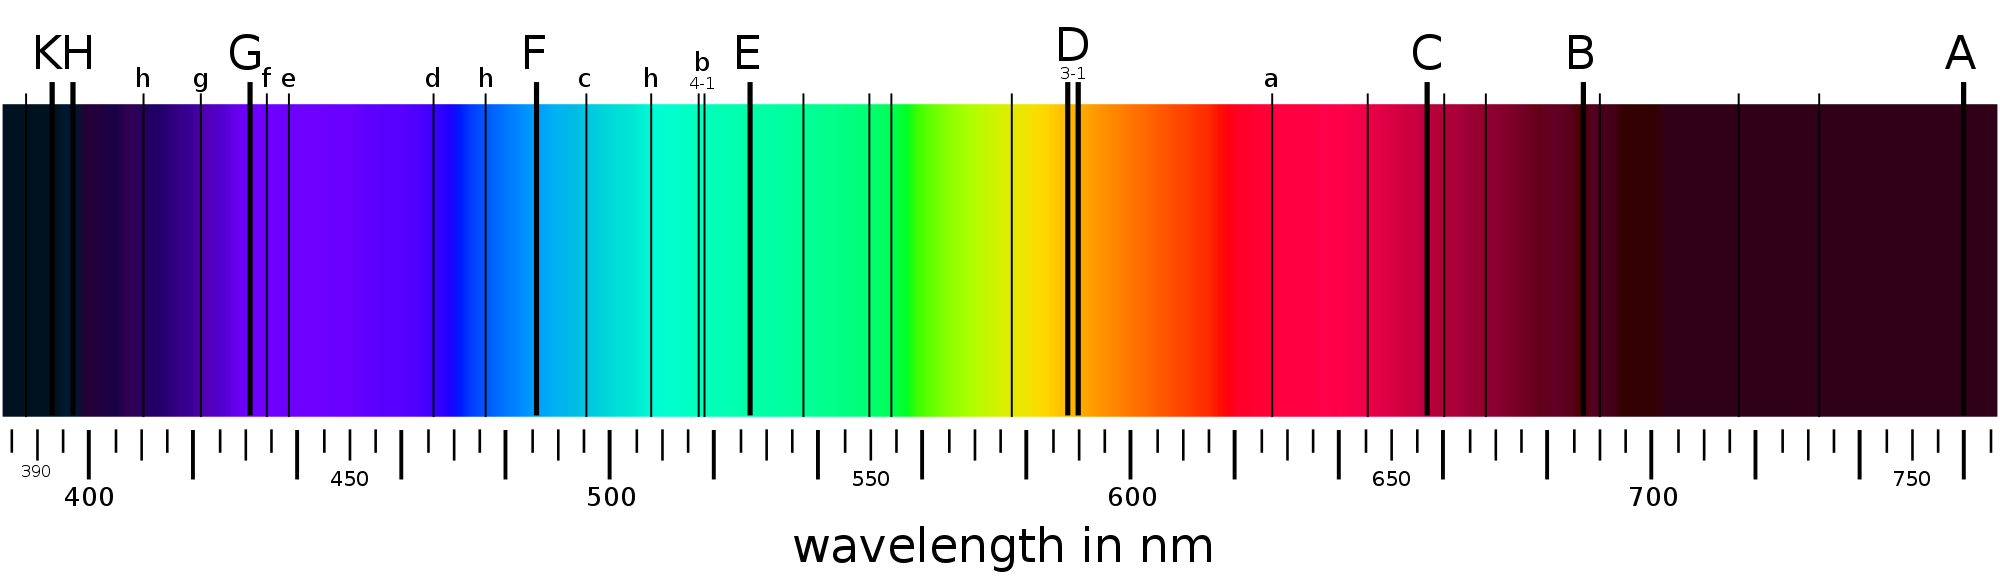
Fig. 31 A graphical representation of the Fraunhofer lines in the Sun’s spectrum. Fraunhofer labelled the strongest lines A through K, whilst the weaker lines were also labelled with lower case letters. Astronomers sometimes still use these names today.#
Fraunhofer lines
Fraunhofer’s optics allowed him to see that the Fraunhofer lines were not “gaps” in the solar spectrum, as Wollaston thought, but were instead absorption lines; discrete wavelengths at which the Sun was fainter, but at which it still emitted light. Fraunhofer was not really interested in these lines from a scientific point of view. Instead, he was looking for a way to calibrate his spectroscope, the precursor to the modern spectrograph. An example of a spectroscope is shown in figure 32; light from the object of study comes down a scope and is focussed on a prism, which disperses the light. Another scope then views the light which emerges from the prism; by moving this scope’s position you detect light of different wavelengths. Fraunhofer was using the Sun’s dark lines as fixed wavelength references, so he could calibrate the relationship between the spectroscope’s position and wavelength. He, nor anyone else at the time, had any understanding of where the dark lines came from.
Kirchhoff & Bunsen#
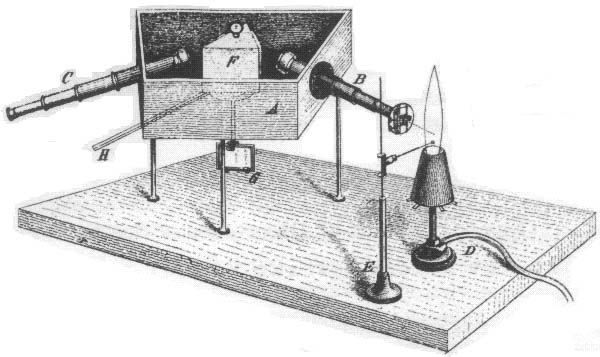
Fig. 32 Kirchhoff & Bunsen’s spectroscope, which they used to look a the spectra produced by burning various elements. Light from the flame is focussed on prism F by scope B. The prism disperses this light and, by moving scope C, the amount of light at a given wavelength can be measured.#
Kirchoff and Bunsen’s spectroscope
A major breakthrough in the understanding of astronomical spectra came with the work of Kirchhoff and Bunsen, between 1859 and 1861. Using a spectroscope of a type designed by Fraunhofer (figure32),they examined the spectra of the flames produced by burning various elements. What they observed was that each element produced numerous bright emission lines, and that the wavelengths of these lines were characteristic of each individual element, and could be used as a “fingerprint” for that element. Kirchhof and Bunsen also produced, by experiment, a series of rules for the type of spectrum observed from various types of light sources (figure 33). They found that hot, dense gasses (or solids) produced continuous a spectrum (the Planck function, we discussed earlier). Hot gasses which were of low density produced a series of emission lines, characteristic to the composition of the gas. Also, they found that when a hot solid or dense gas was observed through a cooler, less dense gas the spectrum observed was a continuous spectrum, but with a series of absorption lines superimposed. The absorption lines were characteristic of the cool gas, and thus presumably produced by it.
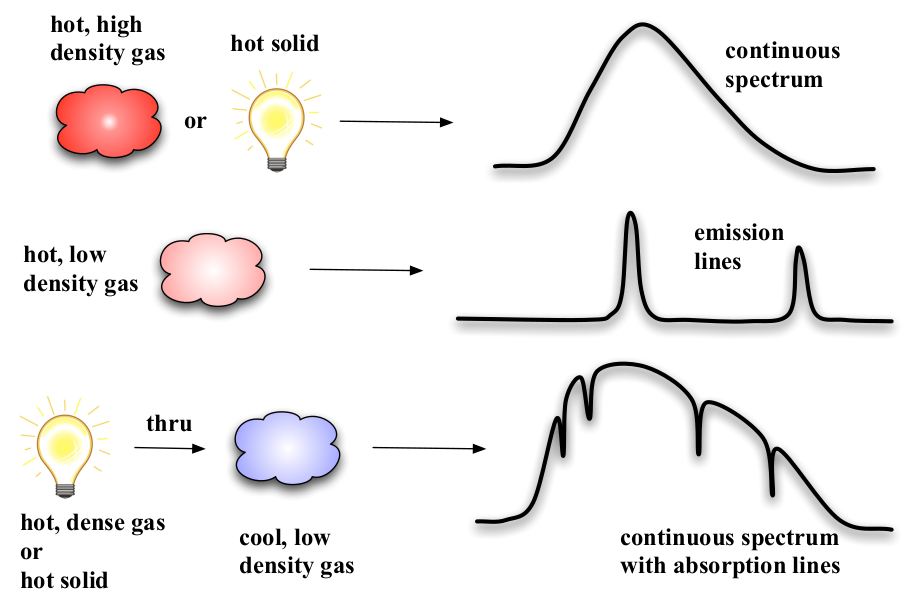
Fig. 33 Kirchhoff & Bunsen’s empirical rules for the type of spectrum observed from different types of light sources.#
Kirchoff and Bunsen’s empirical spectral rules
Kirchhoff and Bunsen’s work allowed an understanding of the origin of the Fraunhofer lines in the Sun’s spectrum. They should the Fraunhofer lines could be identified with lines emitted by known elements (Hydrogen, Calcium, Sodium, etc). The absorption line nature of the solar spectrum implied that we were observing the light from the hot, inner regions of the Sun, after it passed through the cooler surface layers.
Huggins (1863-1864)#
With the work of Kirchhoff and Bunsen, finally there was a framework for understanding astronomical spectroscopy. The effect on astronomers was astounding, the notable British astronomer William Huggins summed up the mood by saying
“Astronomy,the oldest of the sciences, has more than renewed her youth. At no time in the past has she been so bright with unbounded aspirations and hopes” - Huggins (1891).
Huggins in particular took Kirchhoff and Bunsen’s results and put them to great use. Combining large telescopes with early precursors of the modern astronomical spectrograph he obtained many spectra of nearby stars and used the absorption lines in their spectra to work out their composition. In a result that startled many at the time, it turned out that stars were made out of the same material as the Sun, and by extension, from the common elements found on the Earth. In his paper with Miller in 1864, Huggins wrote:
“It is remarkable that the elements most widely diffused through the host of stars are some of those most closely connected with the living organisms of our globe, including hydrogen, sodium, magnesium and iron…” - Huggins & Miller (1864)
Working with his wife, Margaret, Huggins also took some steps towards the understanding of Nebulae. These faint, diffuse, smudges of light were hotly debated at the time. Some claimed they were clouds of brightly glowing gas whilst others argued that they were distant collections of many stars. By taking spectra of the brightest nebulae, Huggins showed that they possessed emission line spectra. Following the work of Kirchhoff and Bunsen, this proved that the brightest nebulae were clouds of hot, sparse gas. Later on, many of the fainter nebulae were shown to have absorption line spectra. It was the work of Hubble and Leavitt in the 1920’s which showed that these nebulae, now called galaxies were very distant collections of stars, like our own Milky Way.
Spectral classification of stars: Secchi (1866)#
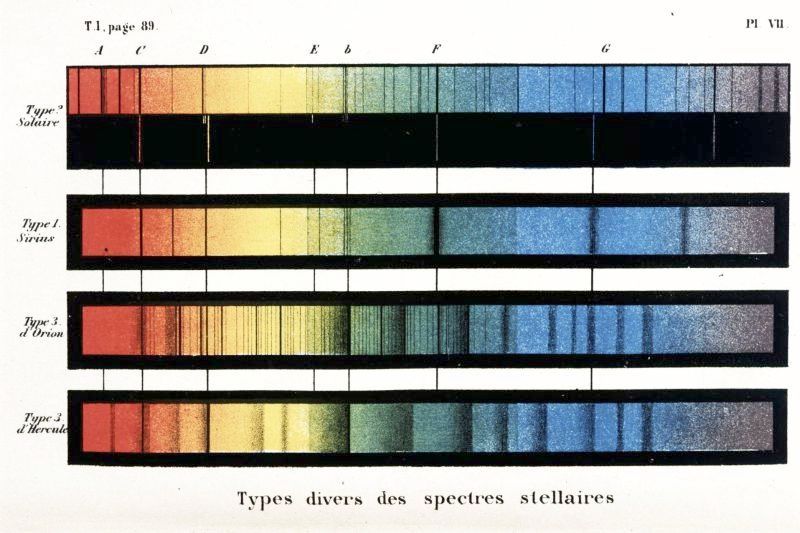
Fig. 34 Secchi’s spectral classification scheme (1866)#
Father Secchi’s spectral classification scheme
Many people were by now acquiring large collections of stellar spectra. It wasn’t long before they noticed patterns emerge, and started to place stars into groups defined by their spectral appearance. This act of spectral classification was not motivated by an understanding of why stars shared similar properties, but instead was a purely empirical exercise, somewhat akin to the classifying of animals into species within Biology. Nevertheless, the eventual spectral sequence of stars would prove to be hugely important within astrophysics, and understanding the spectral sequence will form the next part of our course.
The first spectral classification scheme was devised by a Jesuit priest, Father Angelo Secchi, in 1866. He had acquired of the order of a thousand stellar spectra, and divided them into 4 main classes, based upon the types of absorption lines which appeared in their spectra. Secchi’s sequence is shown in figure 34. The basic idea of Secchi’s sequence; classifying stars by their absorption lines, remains with us today. However, the development of the modern stellar spectral classification scheme required the analysis of a very large number of stellar spectra. In turn, this relied on two developments in astrophysics; one technological, and one social.
The Harvard spectral classification sequence (1886-1892)#
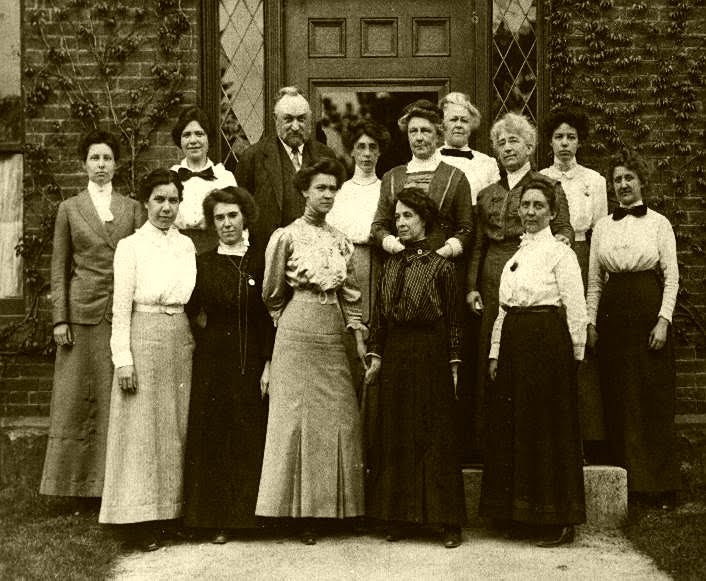
Fig. 35 The Harvard group#
Harvard college observatory staff
The Harvard astronomer Edward Pickering was amongst the first to use objective prism spectroscopy to collect large numbers of stellar spectra. Objective prism spectroscopy uses a large prism to disperse the light from all the stars in the field of view of a telescope. Using the large photographic plates which were newly available, all of these spectra could be recorded in a single image. However, such a large amount of data was being produced, that Pickering and his colleagues could not keep up with it’s analysis. A perhaps apocryphal tale suggests that Pickering, exasperated with the rate of progress provided by his postdoctoral assistants, claimed that even his housemaid could be more productive. Whether or not this is true, Pickering certainly hired his housemaid, Williamina Fleming, and a sizeable staff of other women astronomers. Pickering’s staff was hardworking, dedicated, talented and (most importantly) cheap to employ. Because they were female, they were employed at very low wages, allowing Pickering to process a large amount of data, for very little money.
The large number of women on Pickering’s staff (figure 35) created a stir at the time, and the Harvard group acquired several nicknames, from the slightly insulting “Harvard Computers”, to the downright patronising “Pickering’s Harem”. Despite this, the contribution of the Harvard group to astronomy was considerable. As well as the modern spectral classification scheme, we have already discussed the contribution of Henrietta Leavitt, one of the Harvard group, to the measuring of distance in astrophysics, and our understanding of the scale of the Universe. The Harvard group was also the beginning of large-scale contribution to astronomy by women.
By processing many thousands of stellar spectra between 1886 and 1922, the Harvard group assembled a classification scheme which persists to this day. The scheme is based upon the strengths of absorption lines in the stellar spectrum, and the requirement is that the absorption line strengths must vary smoothly and continuously along the spectral sequence. The Harvard scheme divides stars into seven spectral classes, each denoted by an upper case letter. The letters are OBAFGKM, and they can be remembered, in order, using the (terrible) mnemonic “Oh, Be A Fine Girl, Kiss Me”.
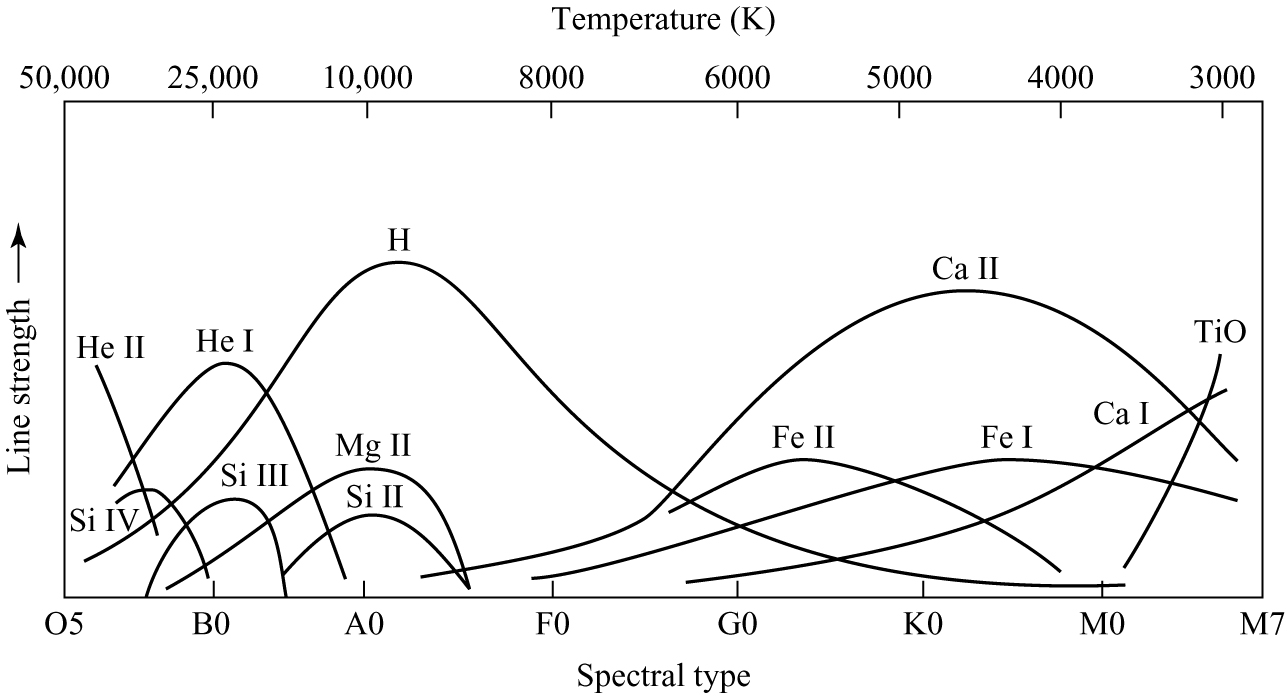
Fig. 36 Detailed behaviour of line strength along the Harvard sequence#
Schematic representation of Harvard sequence
The details of how line strengths vary across the Harvard spectral classification sequence is shown in figure 36. By measuring the relative line strengths in the spectrum of any star it is a simple matter to assign it to a spectral class in the Harvard sequence.
It is worth remembering that, at the time, this work was taxonomical. Although stars could be placed on a sequence on the basis of their line strengths, the physical meaning of this, and what properties of the star changed along the Harvard sequence, were unknown. This is because the classical physics of the time was completely unable to explain the reason why elements produced characteristic absorption and emission lines. If we wish to understand this, and by doing so understand what the Harvard spectral sequence actually represents, we must turn to the beginnings of quantum theory, which was being developed at the turn of the 20th century.